
CHENNAI PETROLEUM: Multi-Signal Breakout with Strong Upside Potential
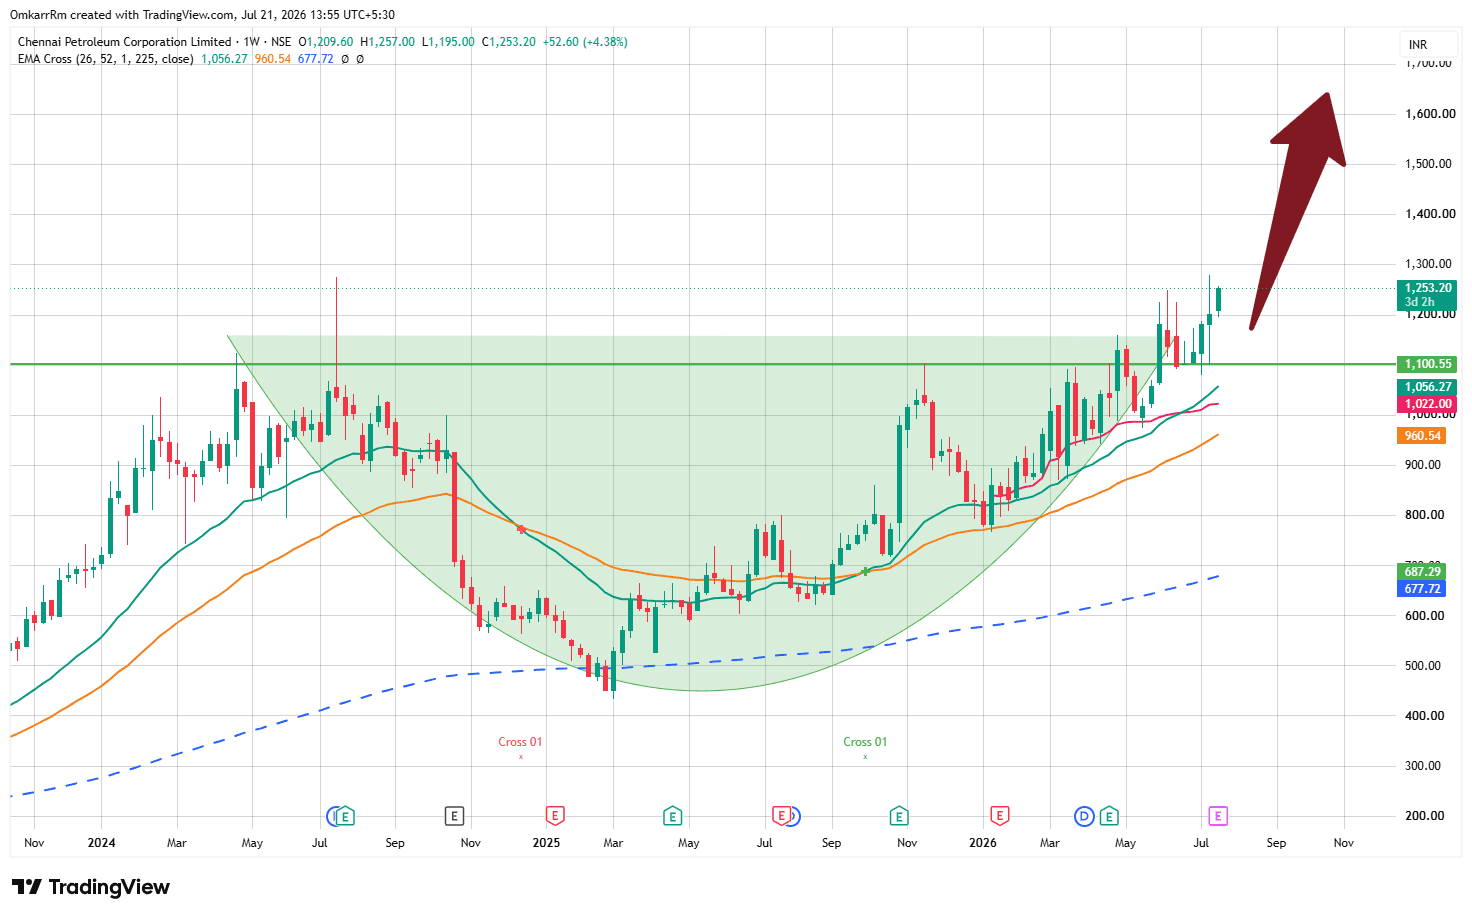
$CHENNPETRO 📈 Technical Analysis ✅ 1. Elliott Wave Structure The stock appears to have completed a prolonged corrective phase and has entered a fresh impulsive wave. The breakout above the long-term resistance zone around ₹1,100 indicates the beginning of a potential Wave 3, which is typically the strongest and longest advancing wave. As long as the breakout level holds, higher targets remain possible over the coming months. ✅ 2. MACD Bullish Divergence During the major correction, price created lower lows while momentum weakened at a slower pace, resulting in a bullish MACD divergence. This positive divergence often signals exhaustion of selling pressure before the start of a sustainable uptrend. The recent price expansion confirms that buyers have regained control. ✅ 3. AVWAP Confirmation The stock has reclaimed and is trading comfortably above its key Anchored VWAP (AVWAP), indicating that institutional participants are positioned on the profitable side. The AVWAP now acts as an important dynamic support. Sustaining above this level strengthens the probability of trend continuation. 💼 Fundamental Strength The technical breakout is supported by improving business quality. Strong return on capital employed (ROCE), reflecting efficient capital allocation. Consistent profitability with healthy earnings visibility. Beneficiary of India's growing refining and energy demand. Improving balance sheet and operational efficiency provide long-term support to the trend. When solid fundamentals combine with a fresh technical breakout, probability often shifts in favor of the trend. 🎯 What the Chart Suggests Major Resistance Broken: Around ₹1,100 Current Trend: Strong Bullish Support Zone: ₹1,100–₹1,150 If Momentum Continues: The stock may gradually move towards the ₹1,500–₹1,650 zone over the medium term, provided it sustains above the breakout level.


