
‹ All Posts
CA Omkar Bhutada - SEBI Reg IA

14th May · SEBI-Registered Analyst

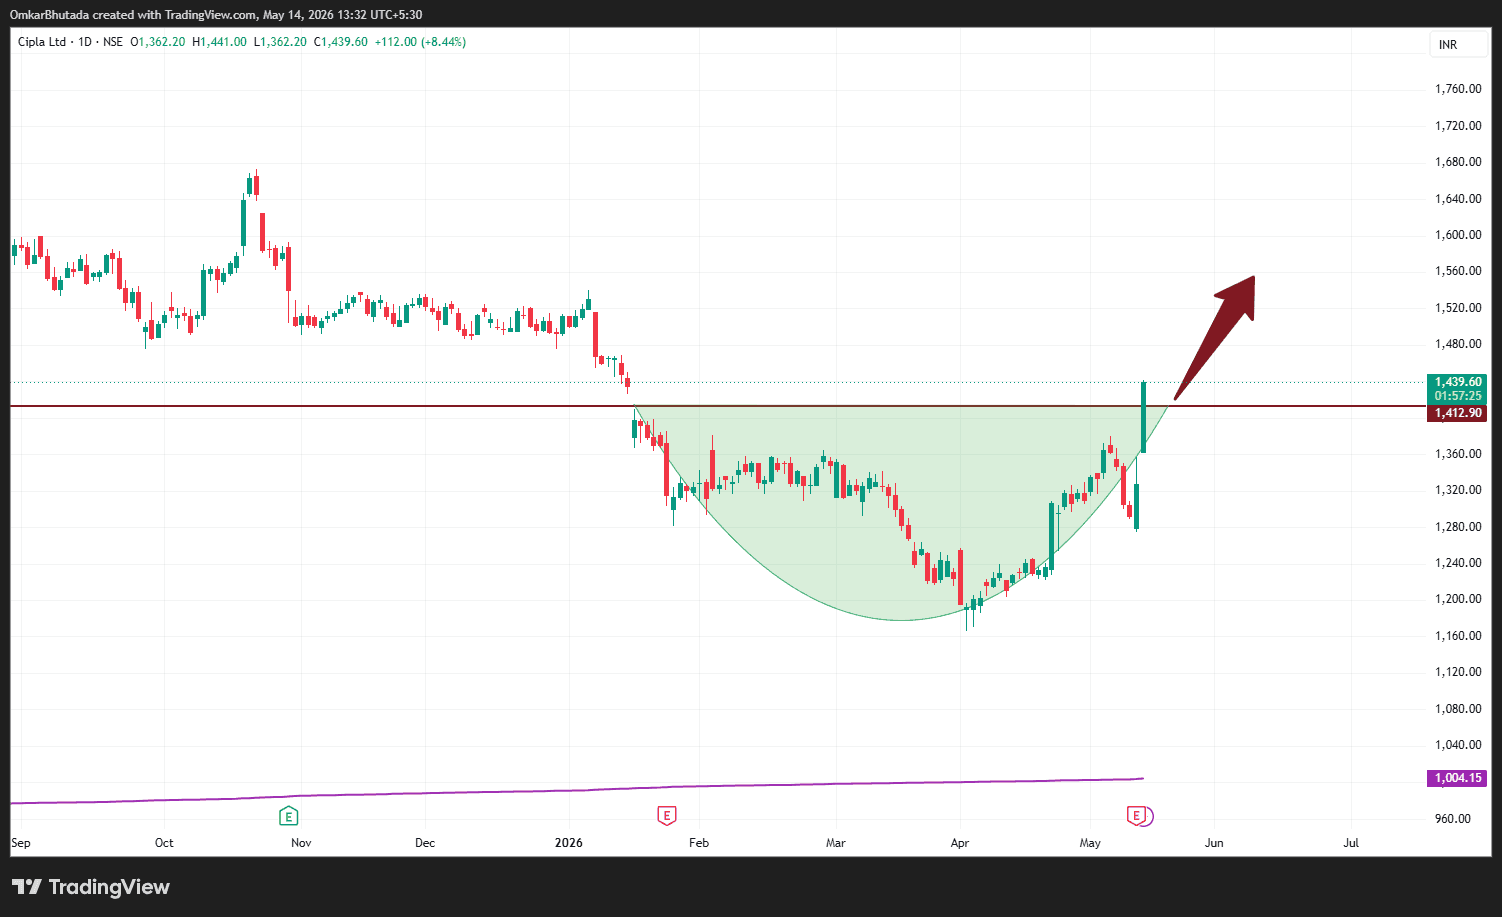
Cipla Ltd is showing one of the cleaner cup breakout continuation structures among the charts you've shared.
CIPLA
Technical Structure A rounded cup pattern formed after a prolonged correction and base-building phase. Price has now decisively reclaimed the neckline zone around ₹1410–1420. The breakout candle is wide-range and impulsive — typically a sign of strong institutional participation. Price is also comfortably above the long-term support line (purple MA), keeping the larger trend healthy. What stands out here Multi-month base → breakout → expansion sequence. Strong recovery from ₹1180–1200 lows. Breakout happened near prior supply, increasing significance. The structure suggests transition from accumulation to markup phase. Key Levels Breakout Zone ₹1410–1420 Immediate Support ₹1360 Major Support ₹1280–1300 Pattern Projection Using cup depth measurement: Target 1: ₹1500–1520 Target 2: ₹1560–1600 The arrow projection on the chart aligns with this measured move. Elliott Wave Perspective Possible count: Wave (1): Recovery from lows Wave (2): Consolidation inside the cup Current breakout may represent early Wave (3) If Wave 3 unfolds, price generally travels faster and farther than expected. Among your recent healthcare names (KIMS, Metropolis, Biocon, Cipla), this setup ranks high because: Clear base formation Breakout already triggered Strong candle at neckline Trend support still intact This looks more like an active breakout than a “watchlist candidate.”

#TechnicalViews#FundamentalViews#HiddenGems#Today’sTradingSetup#StockInNews
CIPLA_2026-05-14_13-32-34.png
859 likes·84 comments