Currency Grow (CA & SEBI Reg IA Omkar Bhutada) · 8th Nov
DCB Bank Ltd – Monthly Chart Analysis
DCBBANK
1️⃣ Structure
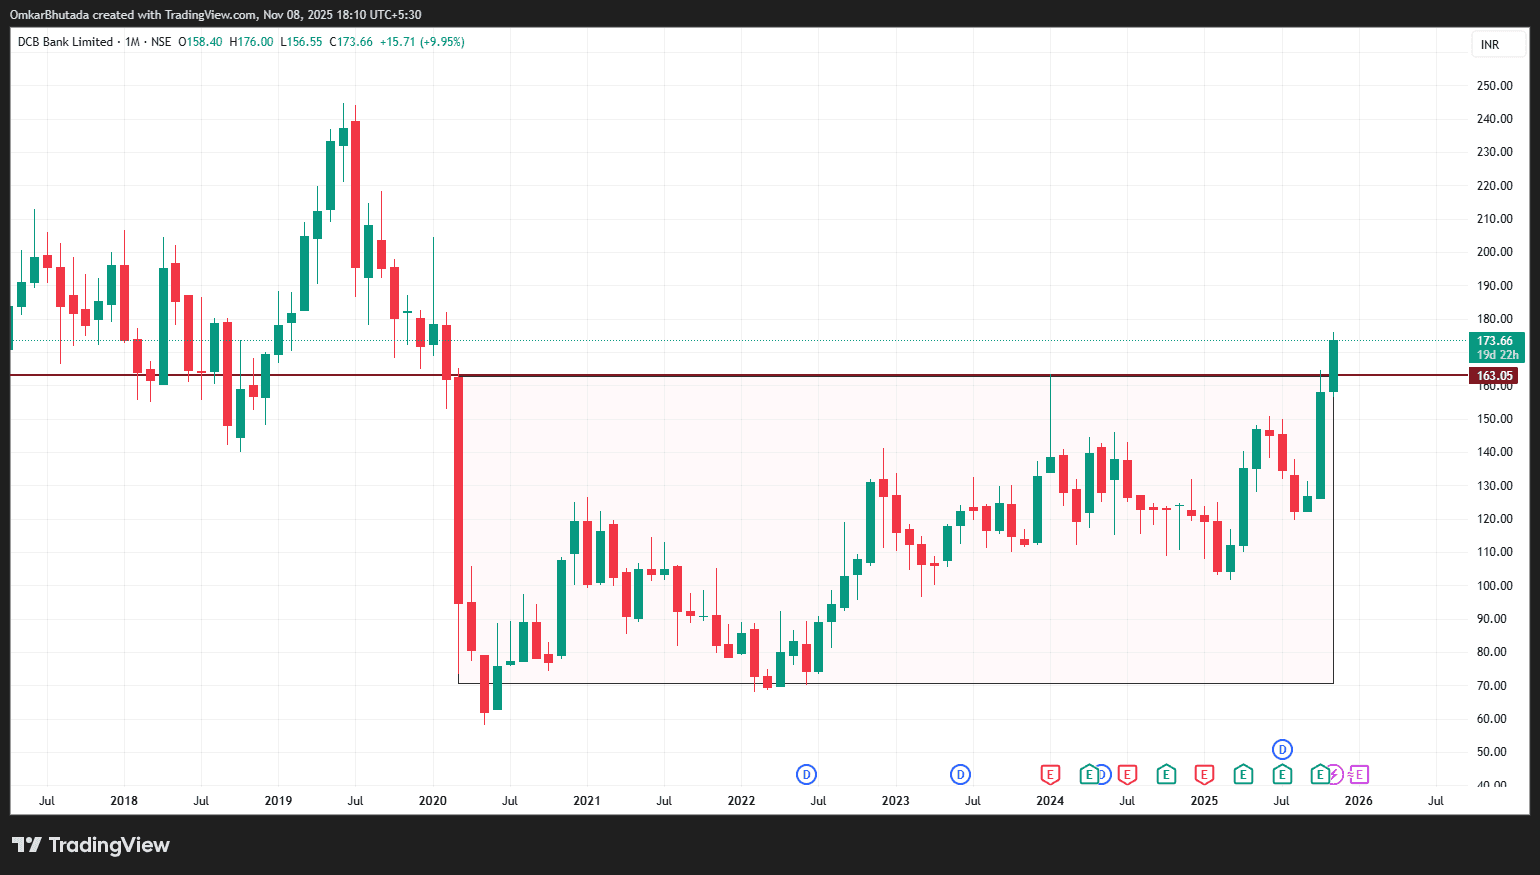
Price has been in a sideways range between ₹80–₹160 for almost 5½ years.
After multiple rejections near ₹160 since 2019, the stock has finally closed above that ceiling with strong volume and a near-10 % monthly move.
This confirms a multi-year range breakout and potential start of a new long-term uptrend.
3️⃣ Pattern Implication
Range height ≈ ₹160 − ₹80 = ₹80
Target = ₹160 + ₹80 = ₹240
That’s an upside of ≈ 38–40 % from breakout levels.
🎯 Target zone: ₹230–₹250
📉 Stoploss: Monthly close below ₹155
4️⃣ Technical Confirmation
First monthly candle close above ₹160 since 2019 → structural breakout.
Momentum indicators (like RSI on monthly) should now enter a bullish 60-80 range.
Likely crossover and flattening of long-term moving averages (100- & 200-week).
Sectoral tailwinds: mid/small private banks showing relative strength vs. PSU peers.
6️⃣ Commentary
This is a classic breakout after multi-year compression, very similar to early breakouts seen in Federal Bank (2016) or IDFC First Bank (2020).
Once a stock clears a 5-year base, it often enters a multi-quarter expansion phase with sustained institutional participation.
If ₹160 holds on monthly closing basis, DCB Bank could be a slow-but-steady compounder, with potential to move toward ₹240–₹250 over 2026.