24th Jun · SEBI-Registered Analyst
Currency Grow (CA & SEBI Reg IA Omkar Bhutada) · 24th Jun
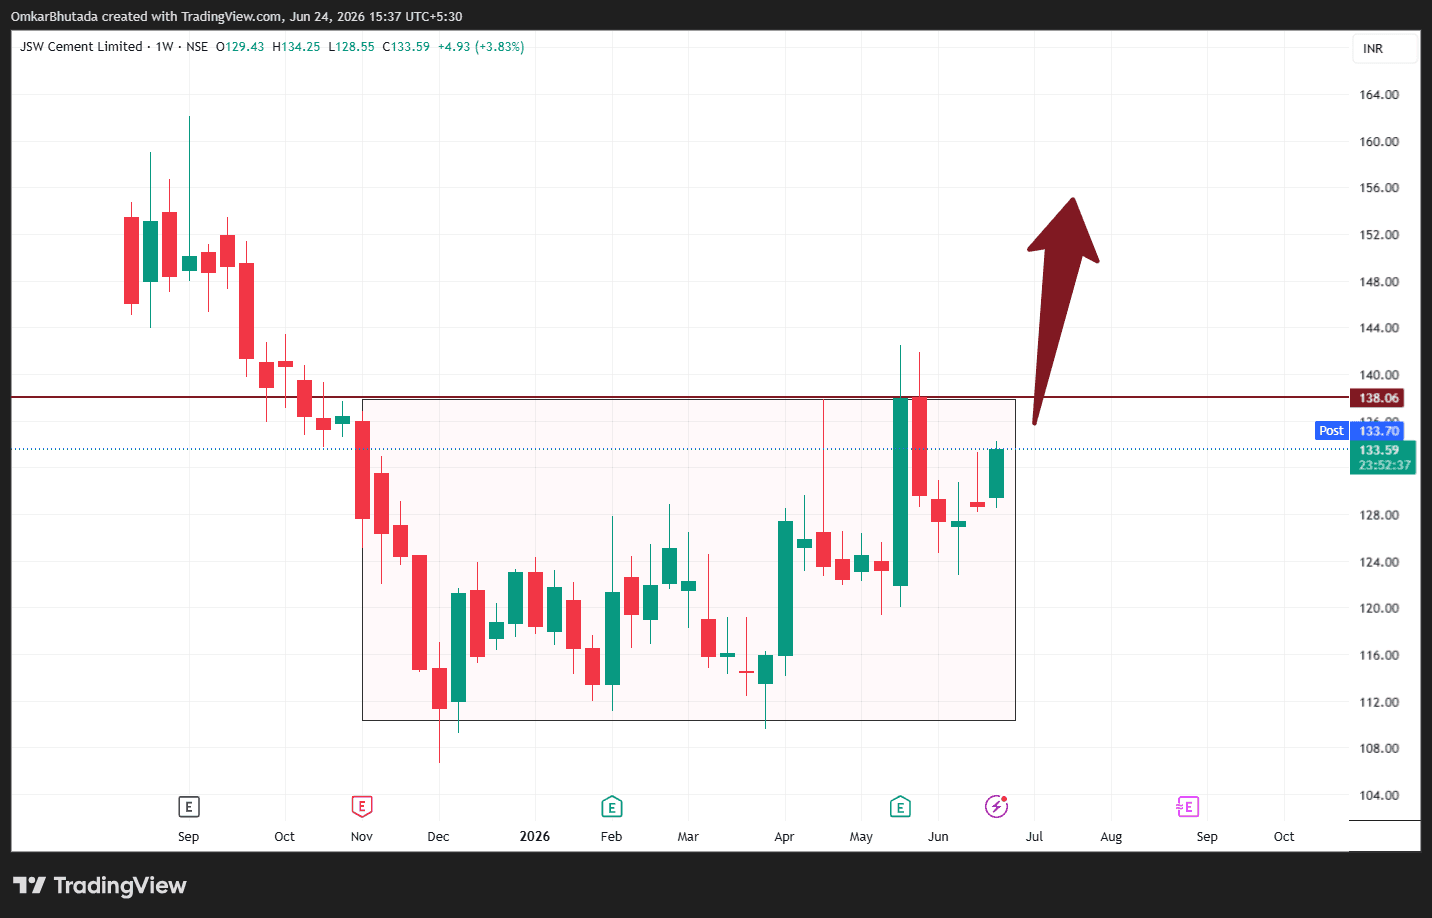
JSW Cement (Weekly Chart) – Technical Analysis
$JSWCEMENT Pattern Structure Rectangle Base The stock has spent nearly 8 months consolidating inside: Resistance: ₹138 Support: ₹110 Range Height: ₹138 - ₹110 = ₹28 The longer a stock consolidates below resistance, the more significant a successful breakout becomes. Current Situation Current Price: ₹133.59 Resistance: ₹138 The stock is not yet a confirmed breakout. It is currently: ✅ Near the top of the range ✅ Making higher lows ✅ Showing improving momentum ❌ Has not closed above ₹138 yet What Would Trigger a Buy? Breakout Confirmation I would like to see: Weekly close above ₹138–140 Volume expansion Follow-through candle Then the probability of a sustained move increases substantially. Target Calculation Rectangle Projection: Resistance = ₹138 Support = ₹110 Height = ₹28 Conservative Target ₹138 + ₹28 = ₹166