β€Ή All Posts
CA Omkar Bhutada - SEBI Reg IA

17th Jul 2025 Β· SEBI-Registered Analyst

OLECTRA GREENTECH – Base Formation with Early Signs of Reversal ⚑🚌

OLECTRA
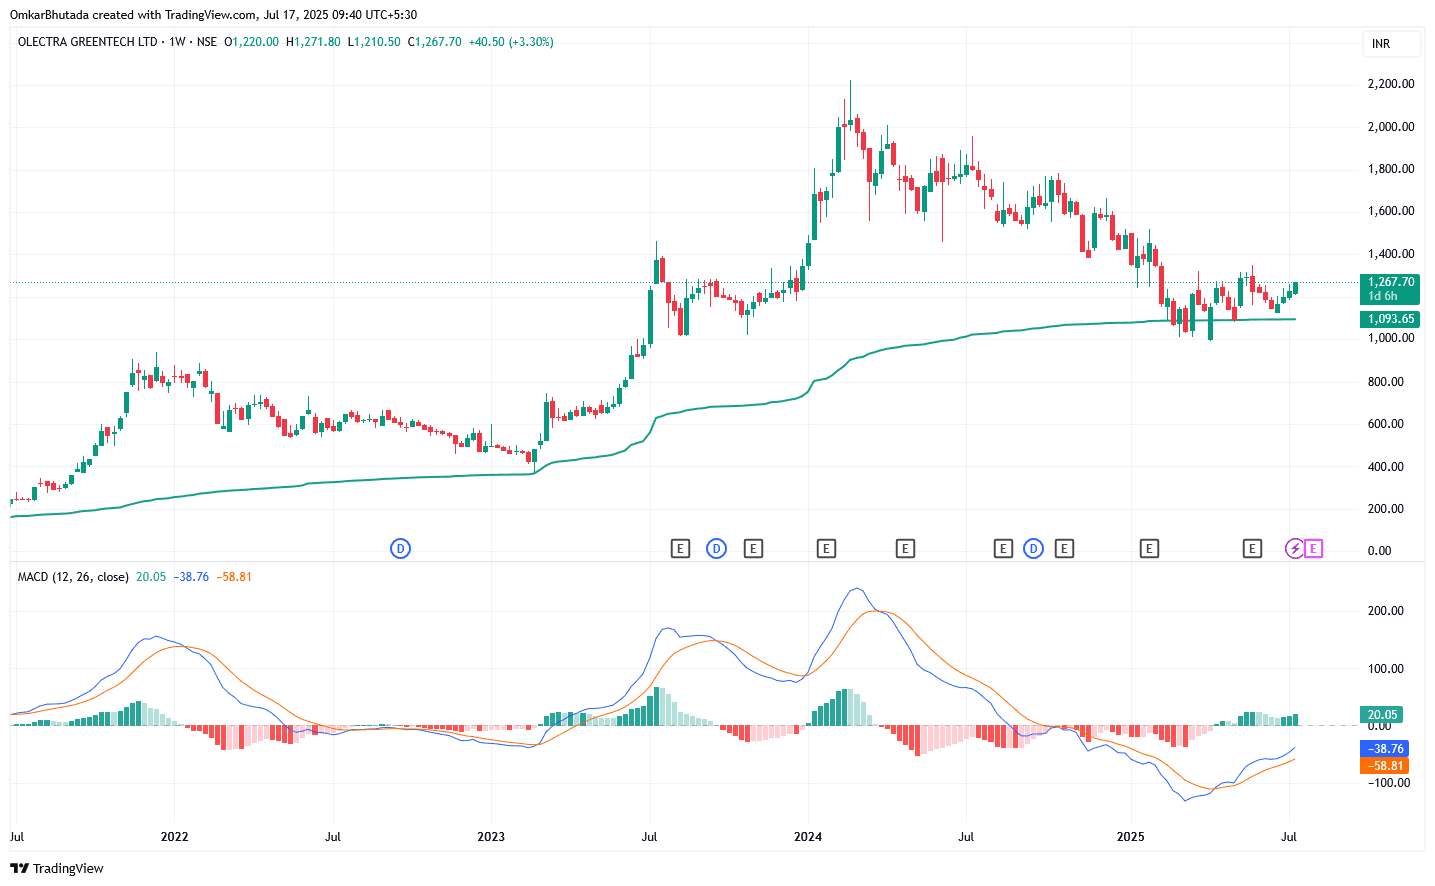
πŸ“Š Chart Structure & Trend Overview: βœ… Timeframe: Weekly πŸ” Current Structure: Rounded bottom / potential base formation πŸ“‰ Previous Trend: Sharp correction from β‚Ή2,300 (Feb 2024) to β‚Ή1,050 (Apr 2025) β€” ~55% decline πŸ“ˆ Now forming Higher Lows for last 3 months with price stabilizing above 200-week EMA πŸ’‘ Technical Highlights: πŸ“Œ 200 EMA Support: Price has taken strong support around β‚Ή1,090 (200 EMA) and is bouncing from there πŸ“ˆ MACD: Clear bullish crossover on weekly chart – MACD line rising above signal line First positive histogram bars visible after a long bearish stretch πŸ”„ Structure: Early signs of a bottoming formation (accumulation zone between β‚Ή1,050–₹1,300) βœ… This week’s candle: Bullish continuation with a 3.3% gain 🧱 Support & Resistance Levels: πŸ›‘ Strong Support: β‚Ή1,050–₹1,090 zone (prior low + 200 EMA) πŸ”Ό Immediate Resistance: β‚Ή1,300–₹1,330 (minor swing high) 🎯 Next Target on Breakout: β‚Ή1,500–₹1,580 range 🧱 Major Resistance: β‚Ή1,780–₹1,800 zone (gap + supply zone) 🧠 Momentum & Psychology: 🧊 Long Correction Phase: Stock has gone through time correction for over a year πŸ’Ή Smart Money Accumulation: Sideways price action with base forming typically indicates institutional buying πŸ” Trend Shift Zone: Price reclaiming key moving average and positive MACD are early trend reversal signals

#Today’sTradingSetup#StockInNews#WatchOutFor#FundamentalViews#TechnicalViews
OLECTRA_2025-07-17_09-40-44.png
1,171 likesΒ·70 comments