
Currency Grow (CA & SEBI Reg IA Omkar Bhutada) · 10th Nov
💊 Orchid Pharma Ltd – Weekly Chart Analysis
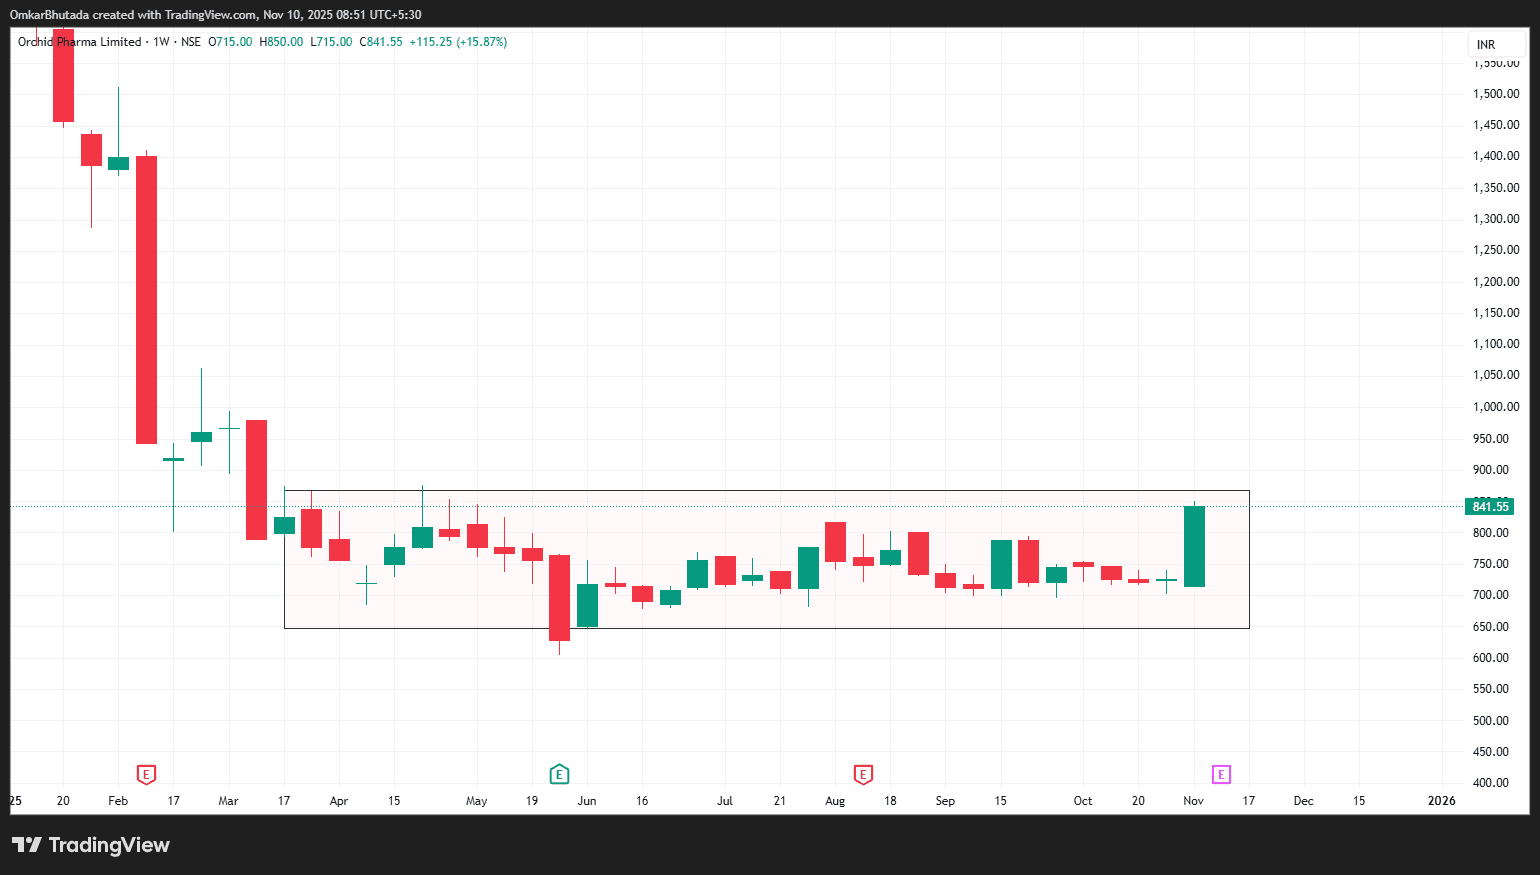
ORCHPHARMA
1️⃣ Structure
The stock was consolidating in a sideways range between ₹630 and ₹850 for nearly 8 months.
After multiple failed attempts, this week’s strong green candle (+15.8%) has closed right at the upper boundary of the range, signaling early breakout momentum.
3️⃣ Pattern Implication
Range height ≈ ₹850 − ₹630 = ₹220
Target = ₹850 + ₹220 = ₹1,070
That’s a ~27% upside from the breakout level.
🎯 Target zone: ₹1,050 – ₹1,100
📉 Stoploss: Weekly close below ₹740
4️⃣ Technical Confirmation
Strong wide-range bullish candle after weeks of tight compression — ideal breakout structure.
Volumes likely to expand in upcoming sessions confirming participation.
A weekly close above ₹850 will officially confirm the breakout.
Once sustained, the next resistance zone is near ₹1,050–₹1,100 (swing highs from earlier).
6️⃣ Commentary
This is a base breakout candidate in the pharma sector, which itself is seeing renewed strength across midcaps.
If momentum sustains, Orchid Pharma could enter a short- to medium-term swing rally toward ₹1,050–₹1,100.
However, as this is the first breakout attempt, traders should wait for a weekly close above ₹850 to confirm validity.