
‹ All Posts
CA Omkar Bhutada - SEBI Reg IA

8th Nov · SEBI-Registered Analyst

💳 Paytm (One 97 Communications Ltd) – Monthly Breakout Analysis
PAYTM
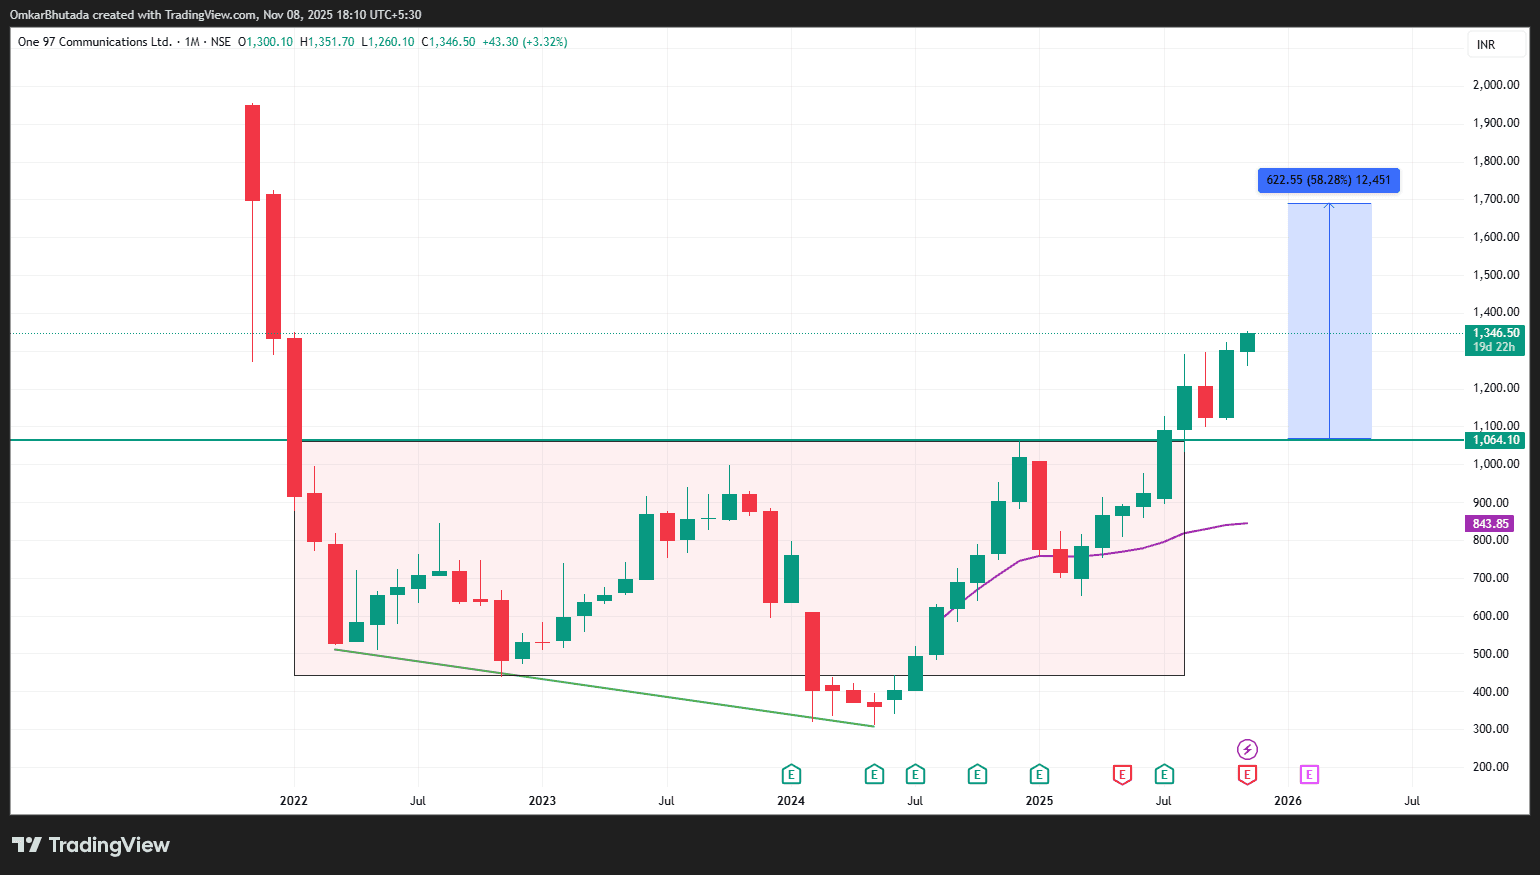
1️⃣ Big-Picture Structure After the 2021 IPO fall, Paytm formed a massive multi-year base between ₹450 – ₹1,060 (approx. 2.5 years of consolidation). Price has now closed above ₹1,060 for the first time since listing — a structural trend reversal from downtrend → sideways → uptrend. This is the first higher-high on the monthly chart — a hallmark of long-term trend reversal. 3️⃣ Pattern Implication Height of the base ≈ ₹1,060 − ₹450 = ₹610 Projected target ≈ ₹1,060 + ₹610 = ₹1,670 – ₹1,750 Upside potential ≈ +55 – 60 % from breakout level 🎯 Target zone: ₹1,650 – ₹1,750 📉 Stoploss: Monthly close below ₹1,000 (avoid whipsaw below breakout retest) 4️⃣ Technical Confirmation 200-week SMA finally flattening and turning upward. 50-month EMA crossing above previous resistance → support flip. RSI on monthly rising from > 60, showing fresh bull momentum. Volume expanding with green candles → institutional accumulation. This is one of the cleanest multi-year base breakouts in the Indian digital-finance space. After years of value compression and negative sentiment, Paytm is now entering a re-rating phase — similar to what happened historically with stocks like IRCTC or Zomato post their long consolidation phases. If volumes sustain above ₹1,300 and the stock holds ₹1,060 on a monthly closing basis, the next leg could be a 50–60 % re-rating rally into 2026.

#WatchOutFor#Today’sTradingSetup#StockInNews#TechnicalViews#FundamentalViews
PAYTM_2025-11-08_18-10-14.png
1,181 likes·16 comments