
‹ All Posts
CA Omkar Bhutada - SEBI Reg IA

11th Jul 2025 · SEBI-Registered Analyst

POWER FINANCE CORPORATION LTD (PFC) – Strong Base Ready for Breakout? 📈
PFC
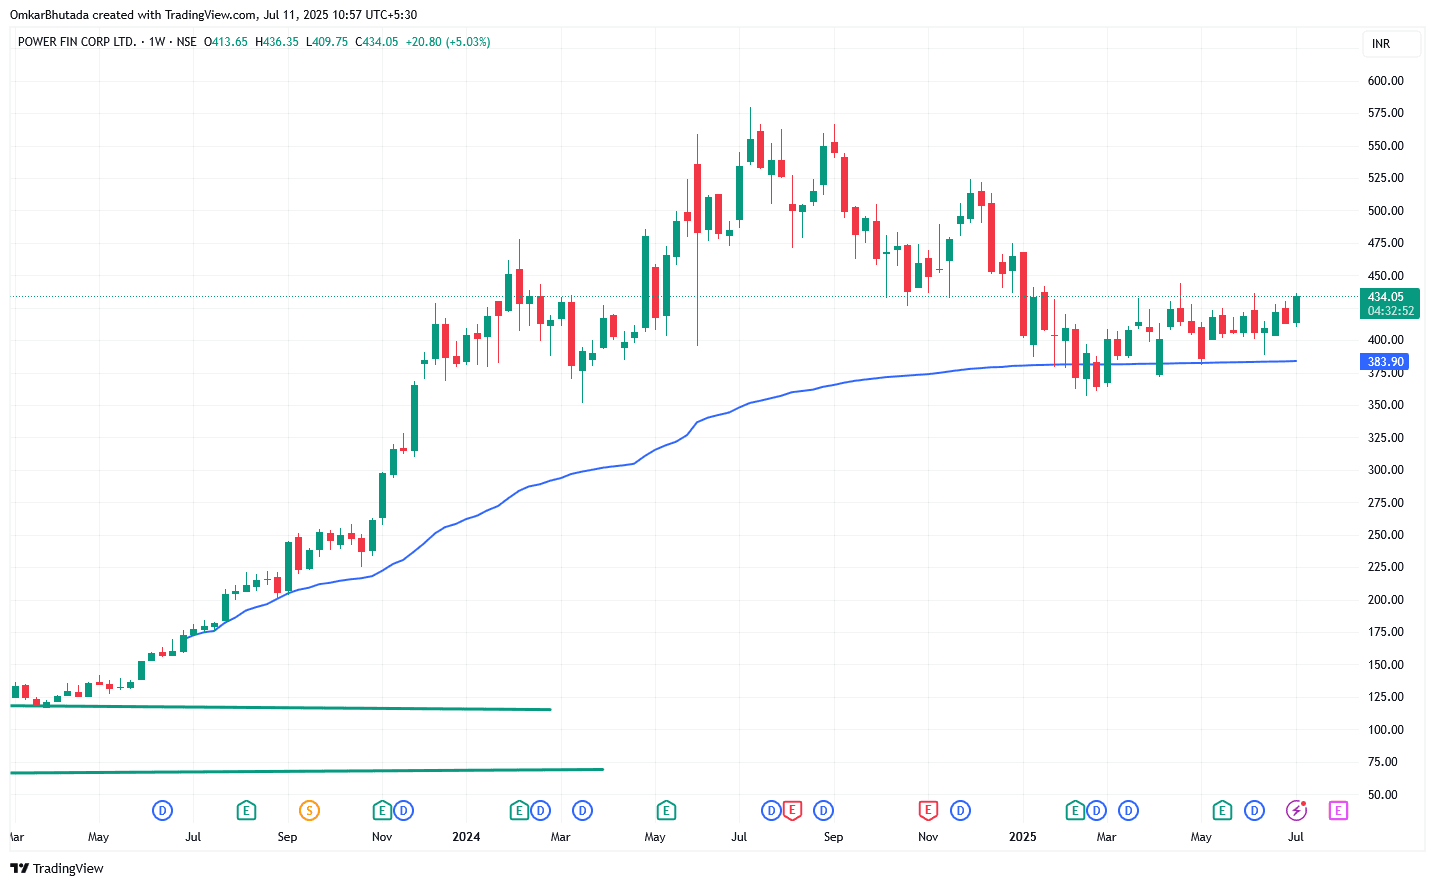
🕵️‍♂️ Weekly Chart Technical Highlights: ✅ Consolidation Breakout Attempt at ₹434 PFC has been consolidating in a sideways range between ₹375–₹435 for several months. The current weekly candle shows a strong breakout attempt from this zone. ✅ Price Above 200-Week EMA (₹383.90) The stock has taken multiple supports at the long-term moving average and rebounded, confirming this as a strong demand zone. ✅ Recent Weekly Close +5.03% A solid green candle with low wick on top signals bullish conviction and follow-through. 🔑 Key Technical Zones: Breakout Zone: ₹435 (decisive weekly close above needed) Immediate Resistance: ₹460–₹480 (previous highs) Major Support: ₹383–₹375 zone (200-week EMA & base low) 📊 Trend & Momentum: 🟢 Structure: Higher lows intact – bullish bias 📈 Accumulation Zone: Multiple rejections from 200-EMA show institutional accumulation 📉 Volatility Shrinking: Classic squeeze breakout setup visible 🔔 Triggers to Watch: 📌 Confirmation Breakout: Weekly close above ₹435–₹440 🎯 Upside Targets: ₹475 → ₹500+ (swing range targets) ⛔ Invalidation: Close below ₹375 (range breakdown) ✅ Summary View: PFC is showing signs of a mature base breakout backed by long-term support and a tightening range. A weekly breakout above ₹435 can open up strong upside towards ₹475–₹500+ in coming weeks.

#Today’sTradingSetup#WatchOutFor#FundamentalViews#TechnicalViews#EquityResearch
PFC_2025-07-11_10-57-08.png
810 likes·78 comments