
โ€น All Posts
CA Omkar Bhutada - SEBI Reg IA

19th Jul 2025 ยท SEBI-Registered Analyst

๐Ÿ“‰ RBL Bank Ltd. (NSE: RBLBANK) โ€“ Potential Bearish Reversal After Strong Rally
RBLBANK
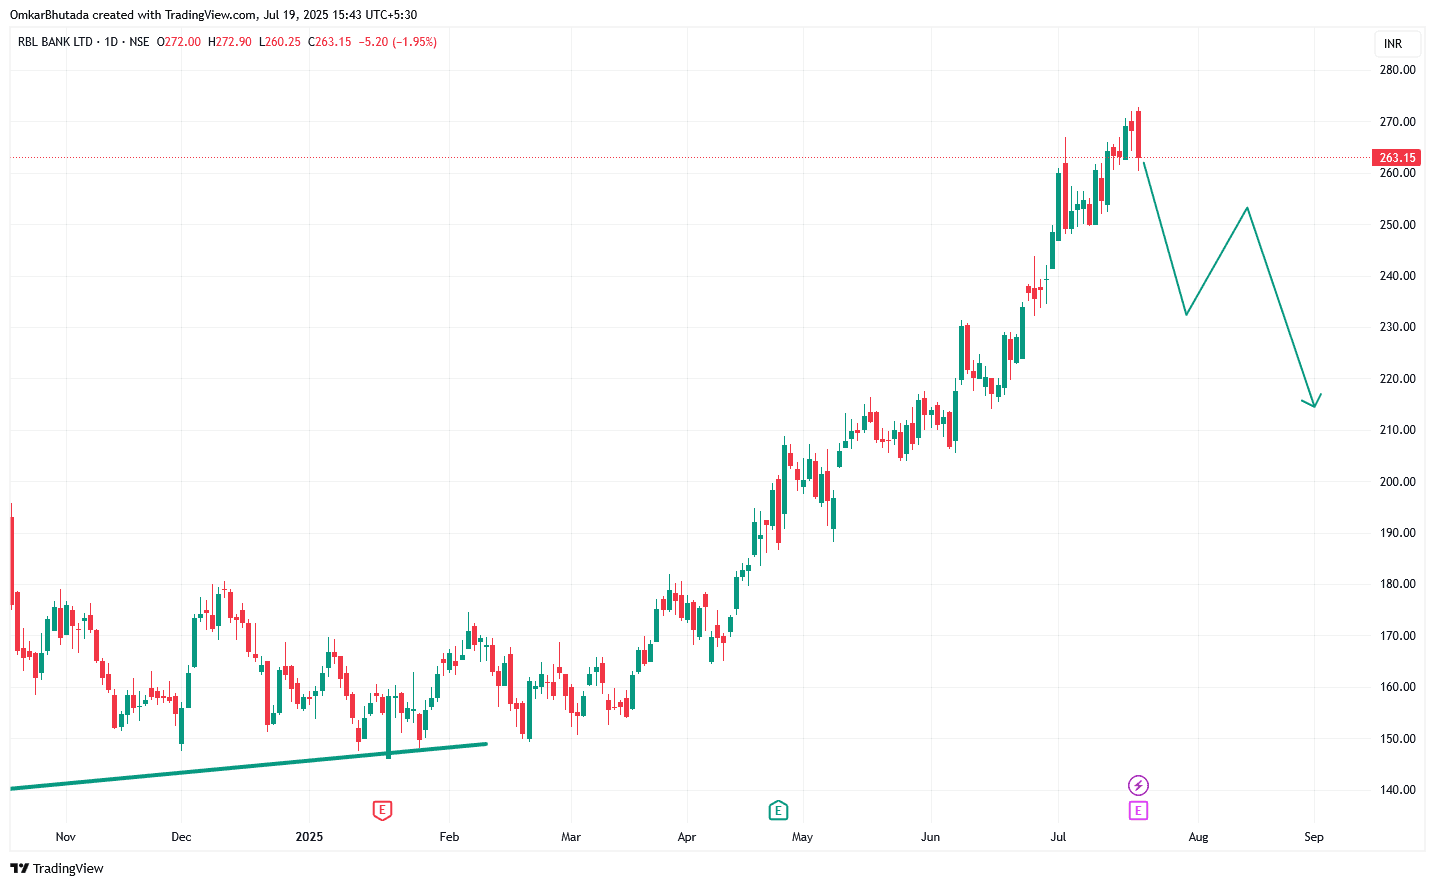
The chart you've provided is a daily candlestick chart for RBL Bank Ltd. (NSE: RBLBANK), with data up to July 19, 2025. Here's a breakdown and analysis of what the chart shows: ๐Ÿ“Š Technical Overview: Current Price: โ‚น263.15 Recent High: โ‚น272 Daily Change: -โ‚น5.20 (-1.95%) ๐Ÿ“ˆ Trend Analysis: Long-Term Trend: The stock has been in a strong uptrend since around March 2025, moving from approximately โ‚น140 to โ‚น272 โ€” nearly a 100%+ gain. Support Zone: There appears to be support near โ‚น230โ€“โ‚น240, a zone that previously acted as resistance in late June. Rising Trendline: A strong upward trendline is visible from December 2024 to February 2025, indicating a base formation before the rally. ๐Ÿ” Projection (Based on Drawing on the Chart): The drawn arrow indicates a potential bearish reversal or a correction phase, which could unfold in three steps: Initial Drop: From the recent top (โ‚น272) to around โ‚น235โ€“โ‚น240. Pullback: A short bounce back near โ‚น250. Further Decline: A drop toward the โ‚น210โ€“โ‚น220 level. This suggests the possibility of a lower high and lower low formation โ€” typically a bearish structure. ๐Ÿ“‰ Bearish Indicators: The latest candle is a strong red bar with a high wick, indicating selling pressure at the top. Momentum seems to be weakening after a sharp rally. Price is far extended from its prior base, increasing the risk of profit-taking or correction. ๐Ÿ“Œ Conclusion: The chart suggests that RBL Bank Ltd. may be entering a corrective phase after a strong rally. If it fails to hold above โ‚น240, further downside towards โ‚น210 cannot be ruled out.

#Todayโ€™sTradingSetup#WatchOutFor#StockInNews#FundamentalViews#TechnicalViews
RBLBANK_2025-07-19_15-43-37.png
496 likesยท30 comments