
β€Ή All Posts
CA Omkar Bhutada - SEBI Reg IA

11th Aug 2025 Β· SEBI-Registered Analyst

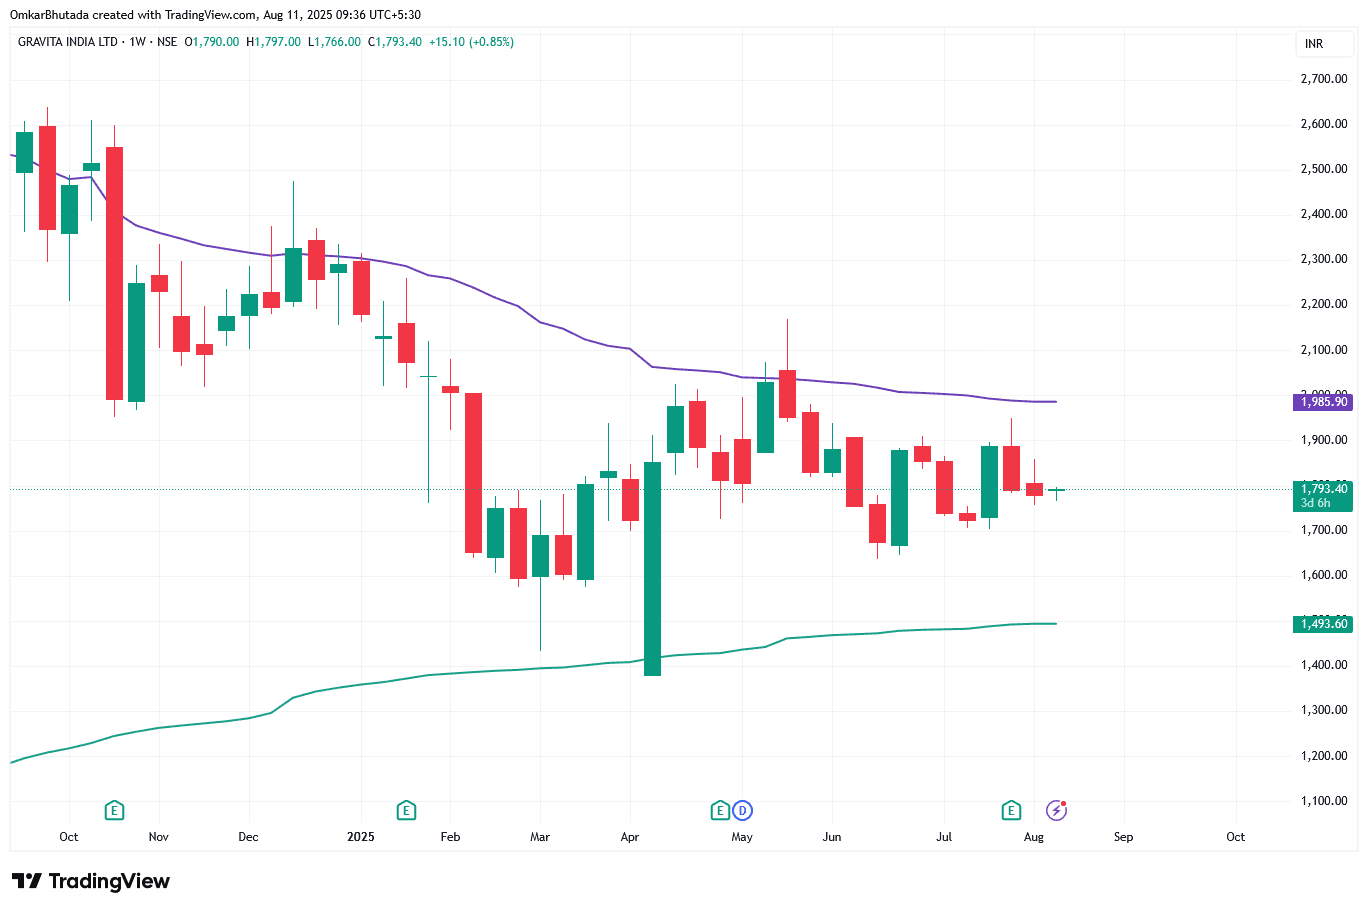
πŸ” Sideways Accumulation in a Downtrend – Waiting for a Trigger
GRAVITA
Technical Snapshot: Overall Trend: Stock is still below the 200-week EMA (~β‚Ή1,985), indicating long-term downtrend intact. Price Behavior: Since April 2025, the stock has been moving sideways between β‚Ή1,700 and β‚Ή1,850, suggesting accumulation or indecision. Key Support: β‚Ή1,493 (200-week support) is far below, giving a cushion for long-term buyers. Upside Barrier: β‚Ή1,850–₹1,900 zone needs a breakout to reverse momentum. Why This Matters: A prolonged sideways move after a decline often indicates that sellers are losing momentum. A strong breakout with volume above resistance could mark the start of a trend reversal. πŸ“Œ Learning Note: In sideways phases, volume and breakout direction matter more than short-term price fluctuations. Without a breakout, price may continue to consolidate or retest lower supports.

#IndexStrategies#WatchOutFor#TechnicalViews#FundamentalViews#EquityResearch
GRAVITA_2025-08-11_09-36-22.png
1,184 likesΒ·71 comments