
Currency Grow (CA & SEBI Reg IA Omkar Bhutada) · 6th Mar
Strong Cup & Handle Breakout on a Fundamentally Solid FMCG Stock
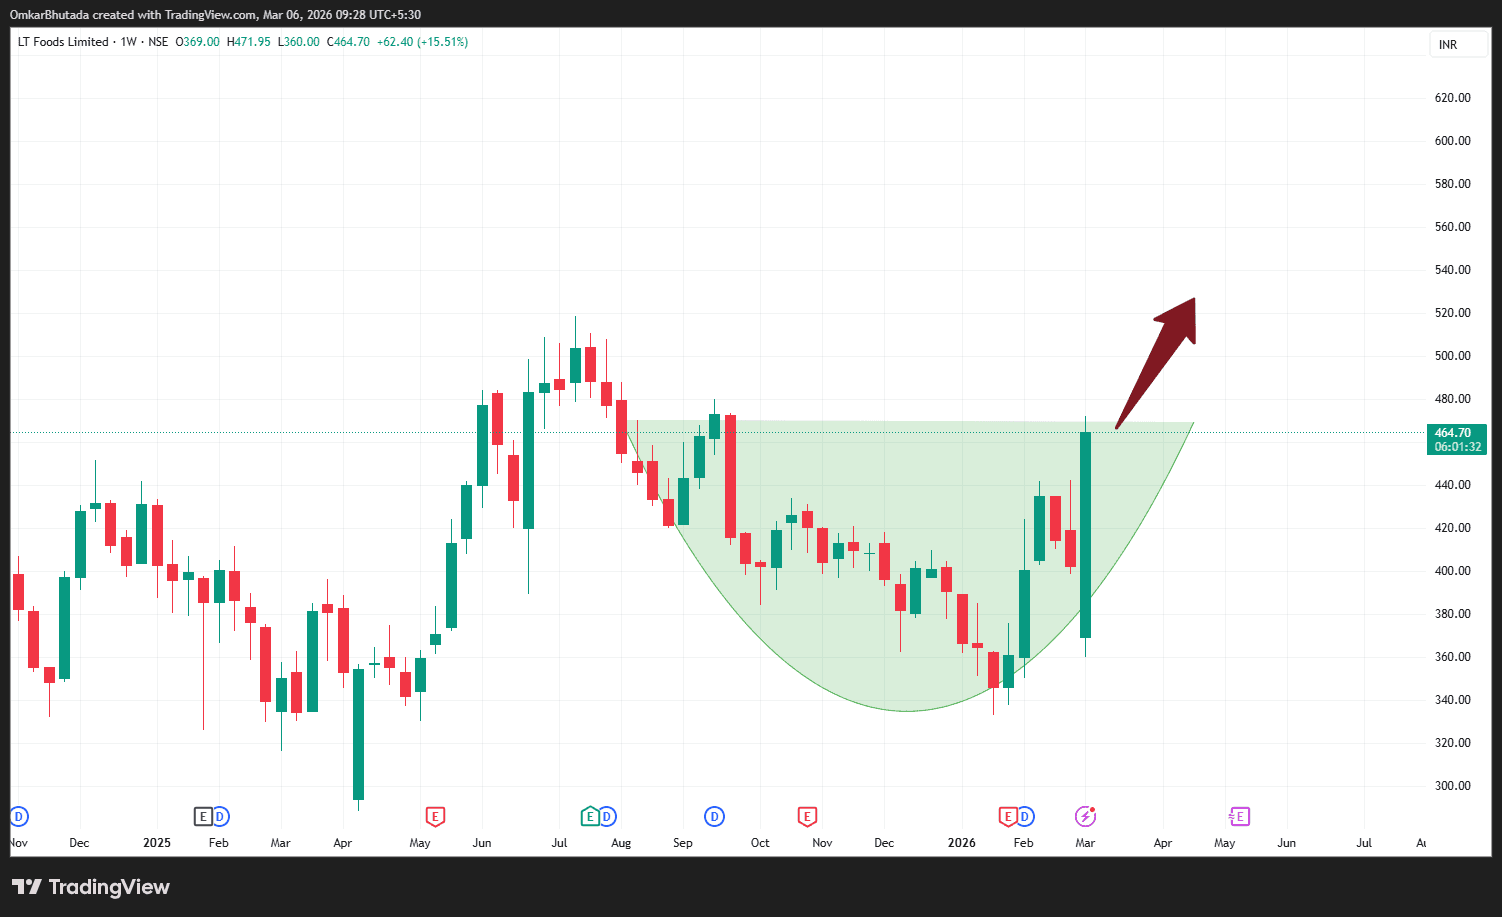
LTFOODS
The weekly chart of LT Foods Limited is showing a powerful technical setup that aligns with strong underlying fundamentals.
1. Elliott Wave Structure
The price action appears to be completing a Wave 2 corrective phase, forming a classic cup structure. The recent strong bullish candle indicates the potential start of Wave 3, which is typically the strongest and most explosive phase in the Elliott Wave cycle. If this interpretation holds, the stock could enter a strong impulsive move in the coming weeks.
2. MACD Bullish Divergence
During the correction phase, the MACD indicator showed bullish divergence — while price was making lower lows, momentum was gradually improving. This often signals seller exhaustion and accumulation, which is now visible through the sharp breakout candle.
3. AVWAP Acting as Support
The Anchored VWAP (AVWAP) from the prior swing high has been acting as a dynamic resistance throughout the consolidation. The current breakout above this level suggests institutional buying pressure returning, turning the AVWAP zone into potential support.
4. Strong Technical Pattern
The chart structure resembles a Cup & Handle formation, a continuation pattern commonly seen before strong upside expansions. The breakout candle indicates demand dominance, and sustained trading above this level could trigger further momentum.
5. Fundamental Strength Supporting the Move
The technical setup is supported by solid fundamentals:
Consistent revenue and profit growth
Healthy ROCE and improving margins
Potential Scenario
If the breakout sustains with volume, the stock could begin a fresh impulsive rally, with momentum traders and institutional flows potentially pushing the next leg higher.
Key Observation:
When technical structure, momentum divergence, and strong fundamentals align, the probability of a sustained trend often increases significantly. 📈