
‹ All Posts
CA Omkar Bhutada - SEBI Reg IA

29th Jul 2025 · SEBI-Registered Analyst

Supreme Industries Ltd ready for reversal?
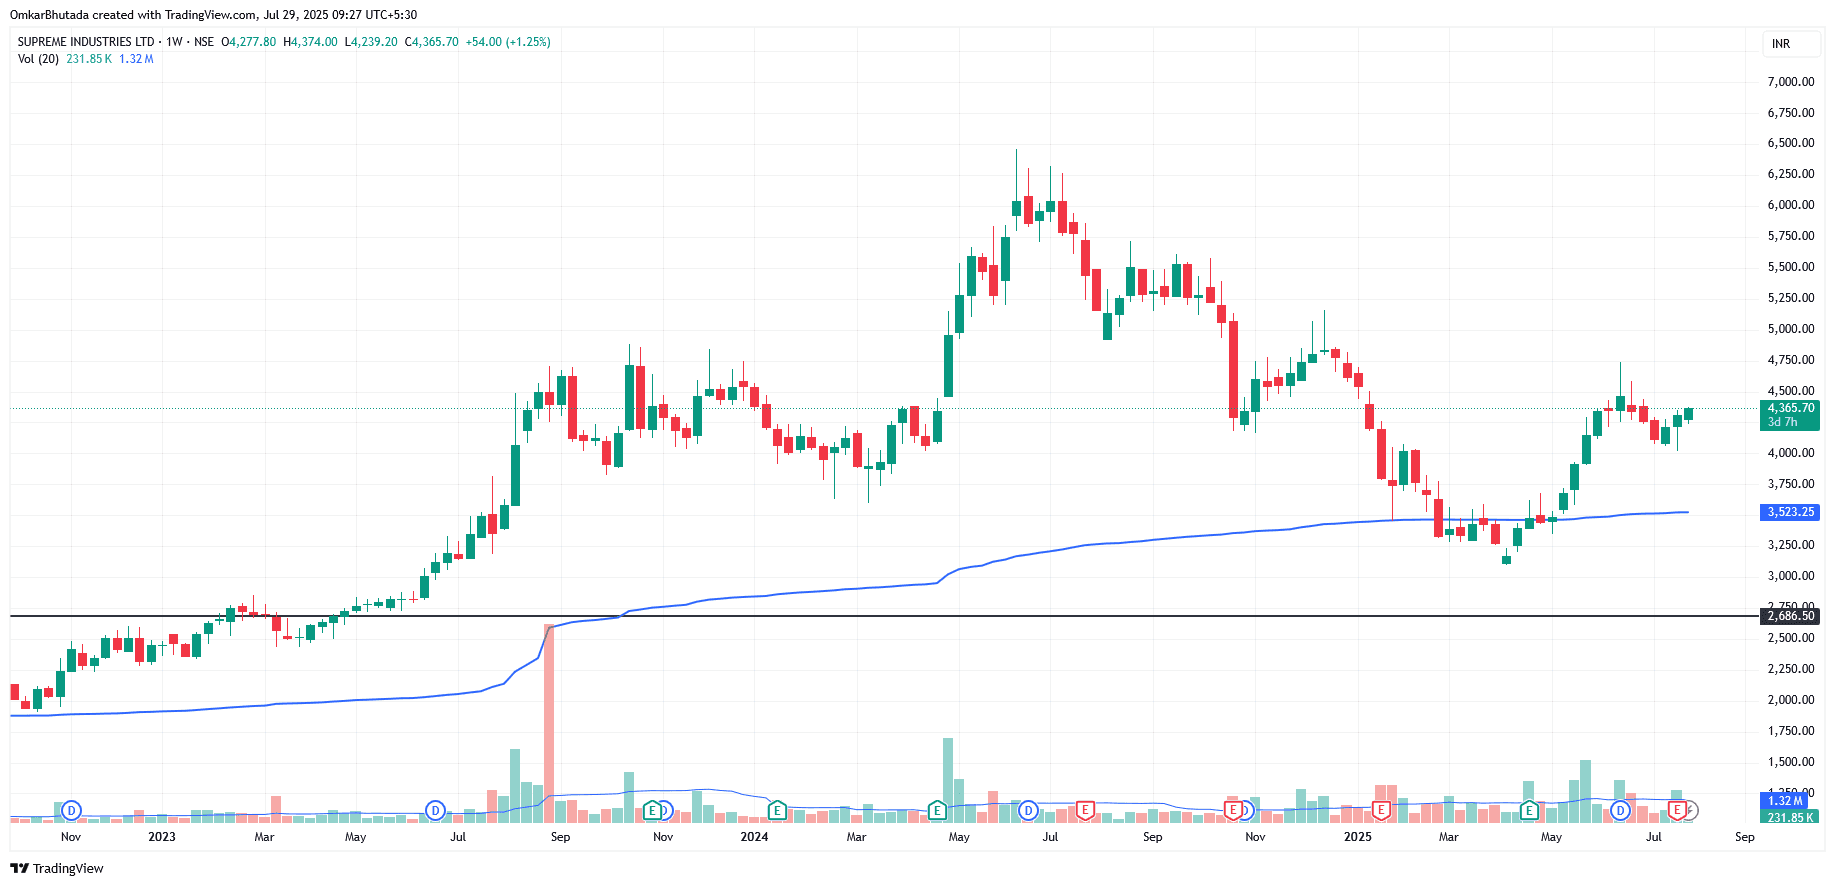
SUPREMEIND
📊 Chart Overview Timeframe: Weekly Indicators: 200-week MA (blue line) Volume Key horizontal support at ~₹2,686 Current Price: ₹4,365.70 Weekly Change: +₹54.00 (+1.25%) 🔍 Key Technical Observations 🔹 1. Strong Base Around ₹2,686 That horizontal line marks multi-year support. The price has never breached this level decisively in the last 2+ years. Long-term investors are clearly defending this level. 🔹 2. 200-Week Moving Average as Dynamic Support The blue MA line is currently around ₹3,523, and price took a sharp bounce from it in recent weeks. This bounce suggests strong institutional buying near the long-term average. 🔹 3. Current Phase – Recovery in Progress After falling from highs (~₹6,500), the stock is showing: Higher lows Sideways-to-upward consolidation If price sustains above ₹4,400–₹4,500, momentum may resume. 🔹 4. Volume Activity Volume has remained moderate but rising with green candles—suggesting steady accumulation. No signs of panic selling in recent corrections.

#WatchOutFor#Today’sTradingSetup#TechnicalViews#HiddenGems#EquityResearch
SUPREMEIND_2025-07-29_09-27-27.png
938 likes·50 comments