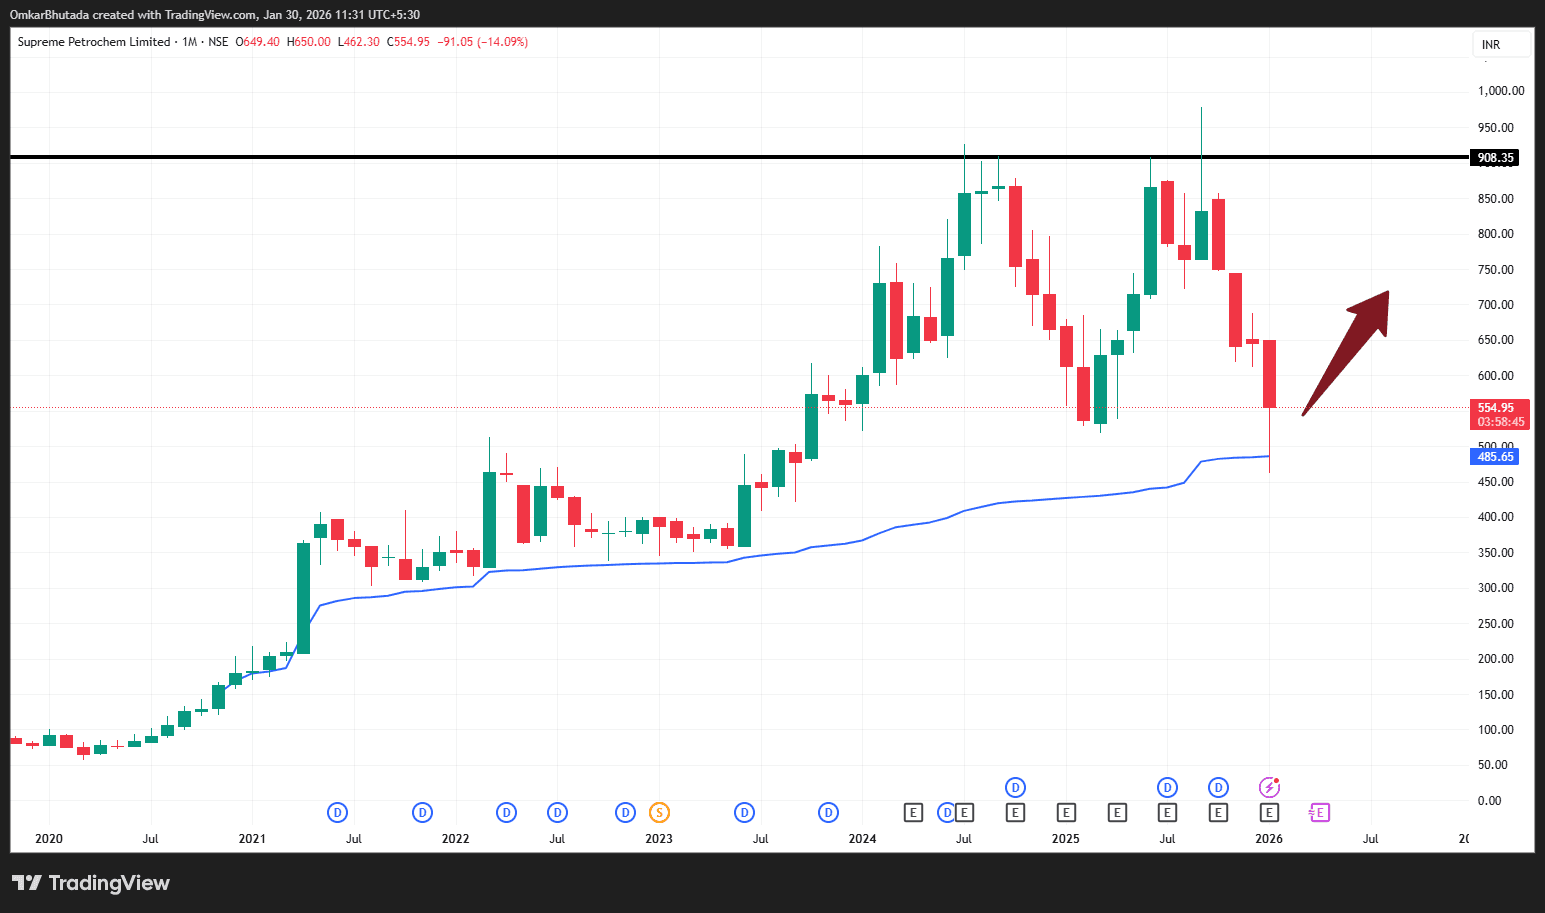
Technical + Structural View (Monthly Chart)
Elliott Wave Structure:
Supreme Petrochem appears to have completed a strong Wave (3) impulse into the ₹900+ zone, followed by a sharp Wave (4) corrective phase. The current leg down is impulsive in nature, suggesting Wave (C) of (4) is still playing out rather than a shallow pullback. Such corrections after extended trends are typically time + price consuming, not V-shaped.
Key Resistance Zone:
The ₹900–910 region (marked on the chart) represents a major supply / distribution zone, where price has faced repeated rejection. The failure to sustain above this level confirms trend exhaustion at higher levels for now.
AVWAP Breakdown (Critical Signal):
Price has decisively broken below the rising AVWAP (anchored from the prior major accumulation). This is a structural negative, indicating that the average institutional participant is now holding losses, increasing overhead supply on any bounce.
Price Behavior & Volatility:
The recent long red candles with expanding ranges point to forced unwinding rather than healthy consolidation. This typically leads to:
A reflex bounce (mean reversion)
Followed by range formation, not immediate trend resumption
Support & Mean-Reversion Zone:
The ₹480–520 region aligns with:
AVWAP proximity
Prior demand cluster
38.2–50% retracement of the entire impulse
This zone increases the probability of a technical bounce, but not necessarily a new uptrend.
Trend Context:
As long as price remains below ₹750–780, rallies are likely to be counter-trend. A sustained move above this zone would be needed to re-establish bullish structure.