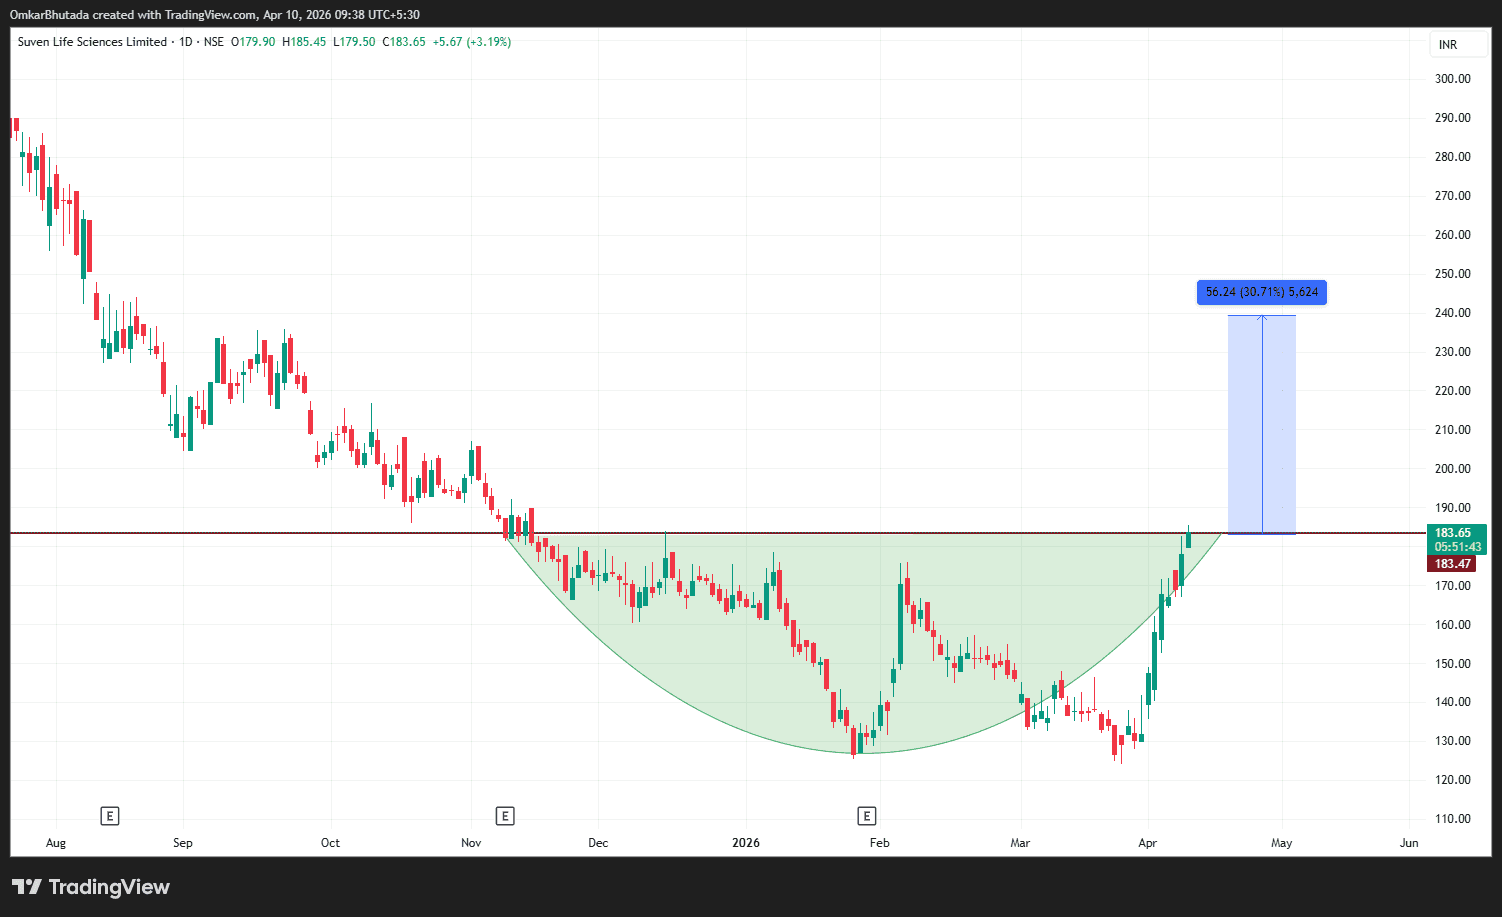
This chart is showing a classic base formation breakout, supported by structure and momentum, indicating a strong positional opportunity.
Technical Structure (Elliott Wave + Price Action)
After a prolonged downtrend, the stock has formed a well-defined rounding bottom pattern, signaling:
Gradual shift from distribution → accumulation
Strong absorption of selling pressure near ₹125–₹135 zone
Transition into a new impulsive phase (Wave 1 / early trend reversal)
The price has now:
Completed the base formation
Broken out near ₹180 resistance zone
This is typically where smart money accumulation converts into markup phase.
Breakout Confirmation
Clean breakout above ₹180–₹185 resistance
Strong bullish candles with follow-through
No major supply visible immediately above
This confirms a high-probability trend reversal setup.
Pattern Target (Measured Move)
Depth of rounding base projected upward
Target comes around ₹235–₹240 zone (~30% upside)
This aligns with the marked projection on the chart.
Momentum & Strength
Sharp rally from ₹130 to ₹180 shows strong buying interest
Structure of higher highs & higher lows forming post breakout
Indicates trend strength, not just short covering
Key Levels to Watch
Immediate Support: ₹170–₹175
Strong Support: ₹155–₹160
Resistance / Target Zone: ₹230–₹240
Risk-Reward Insight
At current levels:
Downside risk is relatively defined (below ₹170)
Upside potential remains 25–30%
This creates a favorable positional trade setup.
Conclusion
Suven Life Sciences is displaying:
Rounding bottom (accumulation pattern)
Strong breakout above key resistance
Early stage of a new bullish cycle
As long as price sustains above ₹175–₹180, the probability favors a continued upmove toward ₹230+ levels.