
TCS: Range Breakout Setup Signals a Potential Trend Reversal
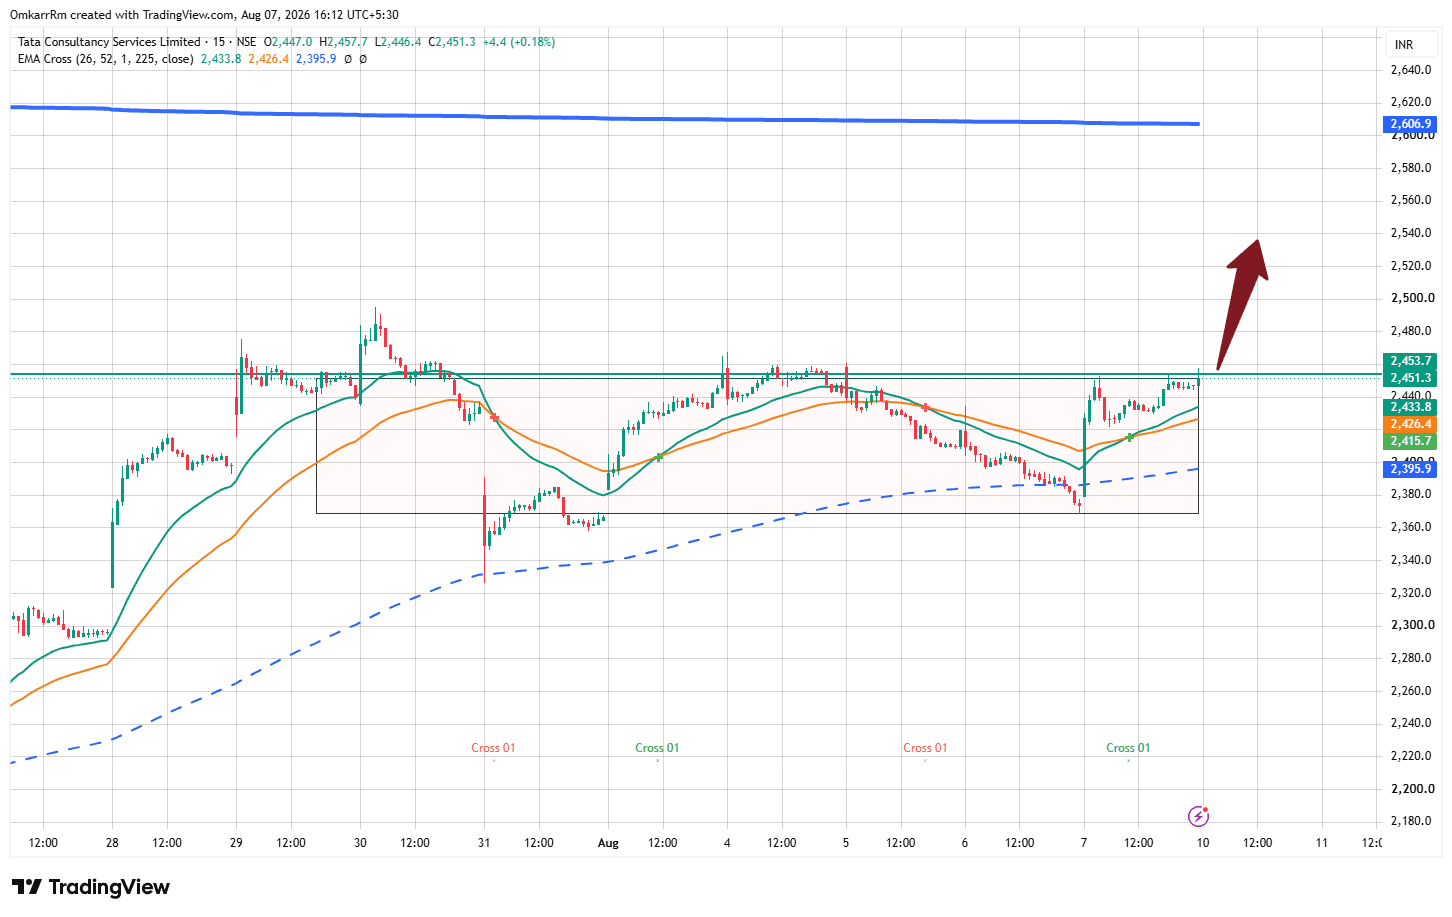
$TCS 📈 Technical Analysis ✅ 1. Elliott Wave Structure After completing a corrective phase, the stock appears to be forming the early stages of a new impulsive move. The ongoing consolidation near ₹2,450 resembles a Wave 2 pause after the initial recovery. A decisive close above this resistance could confirm the beginning of Wave 3, which is typically the strongest phase of an Elliott Wave cycle. ✅ 2. Bullish MACD Confirmation The MACD has shifted into positive territory following the recent recovery, indicating strengthening buying momentum. There is no visible bearish divergence, suggesting the current move is supported by healthy momentum. A sustained positive MACD crossover would further strengthen the bullish outlook. ✅ 3. AVWAP Acting as Dynamic Support The stock is trading above its key Anchored VWAP (AVWAP), indicating that institutional participants are gradually accumulating positions. The AVWAP is acting as a dynamic support, with recent pullbacks finding buying interest near this level. Holding above the AVWAP improves the probability of a successful breakout. 💼 Fundamental Strength TCS continues to remain one of India's strongest technology companies. Consistently high ROCE and industry-leading operating margins. Strong cash generation with a debt-free balance sheet and regular dividend payouts. Long-term digital transformation, cloud adoption, artificial intelligence, and enterprise modernization continue to support revenue growth. Global client diversification and a robust order book provide stability across business cycles. 🎯 What the Chart Suggests Key Breakout Level: Around ₹2,450 Current Trend: Bullish Bias Immediate Support: ₹2,420–₹2,435 If Breakout Sustains: The stock has the potential to gradually move towards the ₹2,600–₹2,700 zone over the medium term while maintaining a higher high–higher low structure.


