
Currency Grow (CA & SEBI Reg IA Omkar Bhutada) · 27th Jan
🔍 Technical + Fundamental Snapshot (Based on the Chart Shared)
DCBBANK
1️⃣ Elliott Wave Structure
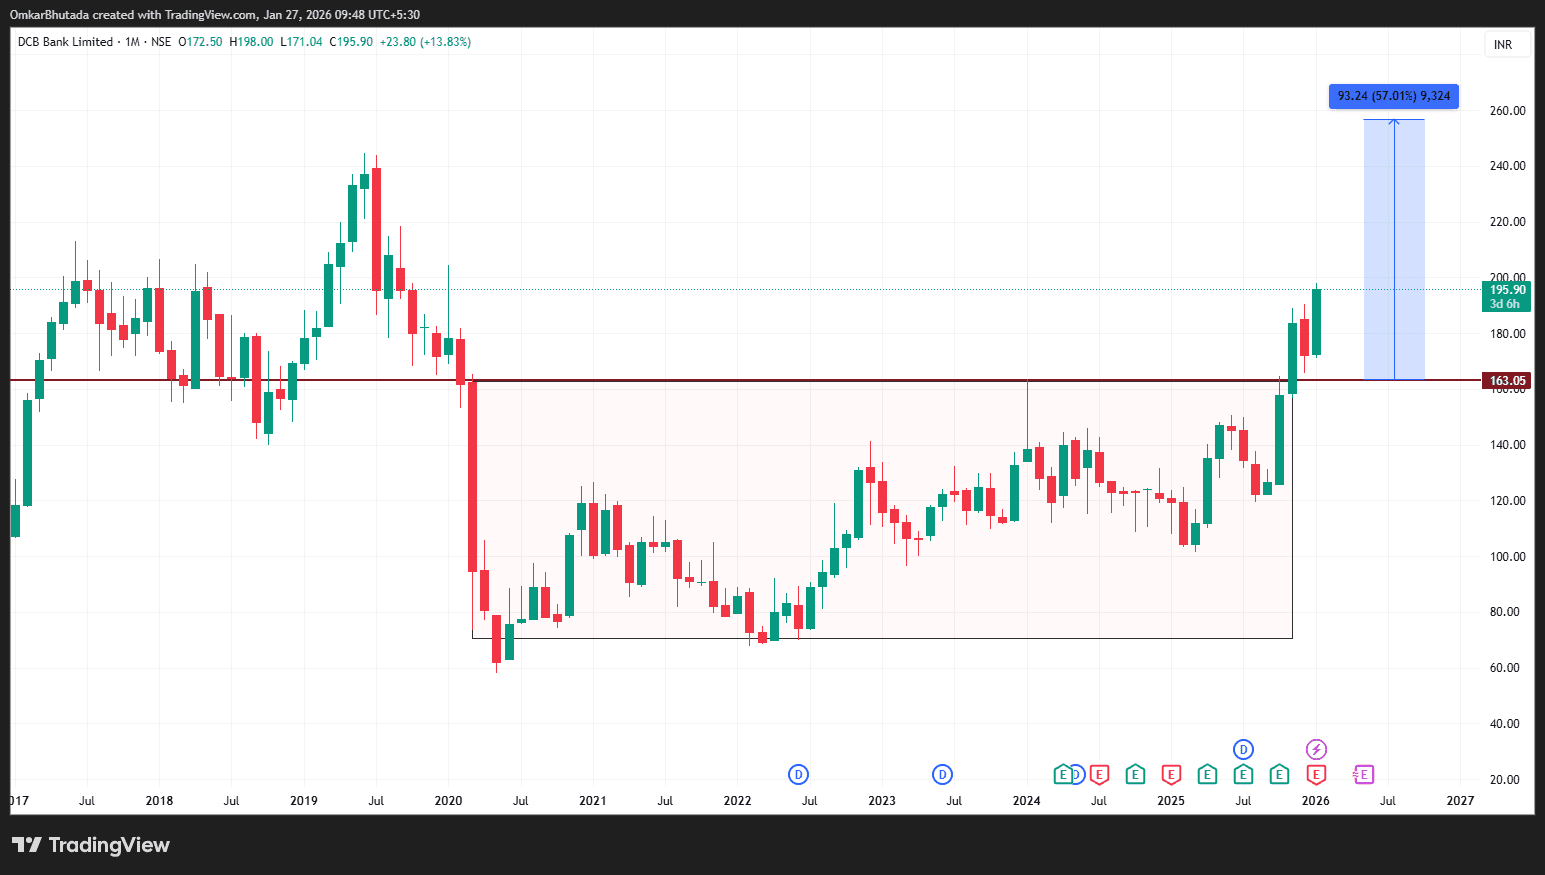
The stock spent multiple years forming a broad accumulation base after a sharp decline, which fits well with a large corrective Wave (2) or Wave (A)-(B)-(C) completion.
The recent strong impulsive breakout above the long-term resistance zone (~163) signals the start of a new Wave (3) or primary impulsive advance.
The strength and vertical nature of the breakout candle strongly favor trend initiation rather than a mere pullback rally.
2️⃣ Momentum Confirmation (MACD Logic via Price Expansion)
Even without focusing on indicator values, the range expansion and follow-through after breakout imply that momentum has decisively shifted bullish.
Such breakouts after long bases typically align with MACD moving into positive territory, supporting the case for sustained upside rather than quick mean reversion.
3️⃣ AVWAP / Resistance Turned Support
The horizontal level around ₹160–165, which capped price for several years, now acts as a major AVWAP / volume-based support zone.
Acceptance above this level suggests strong institutional participation and reduces the probability of a false breakout.
As long as price holds above this reclaimed zone, dips are more likely to be buy-the-dip opportunities than trend failures.
4️⃣ Measured Move & Structure Projection
The highlighted projection shows a classic base breakout measured move, pointing toward the ₹250–260 zone.
This target aligns well with prior swing structures and the height of the accumulation range, adding technical symmetry to the setup.