8th Aug · SEBI Registration INA000015826
SEBI Registration INA000015826 · 8th Aug
The Mphasis chart looks constructive and is one of the cleaner breakout setups among the IT stocks.
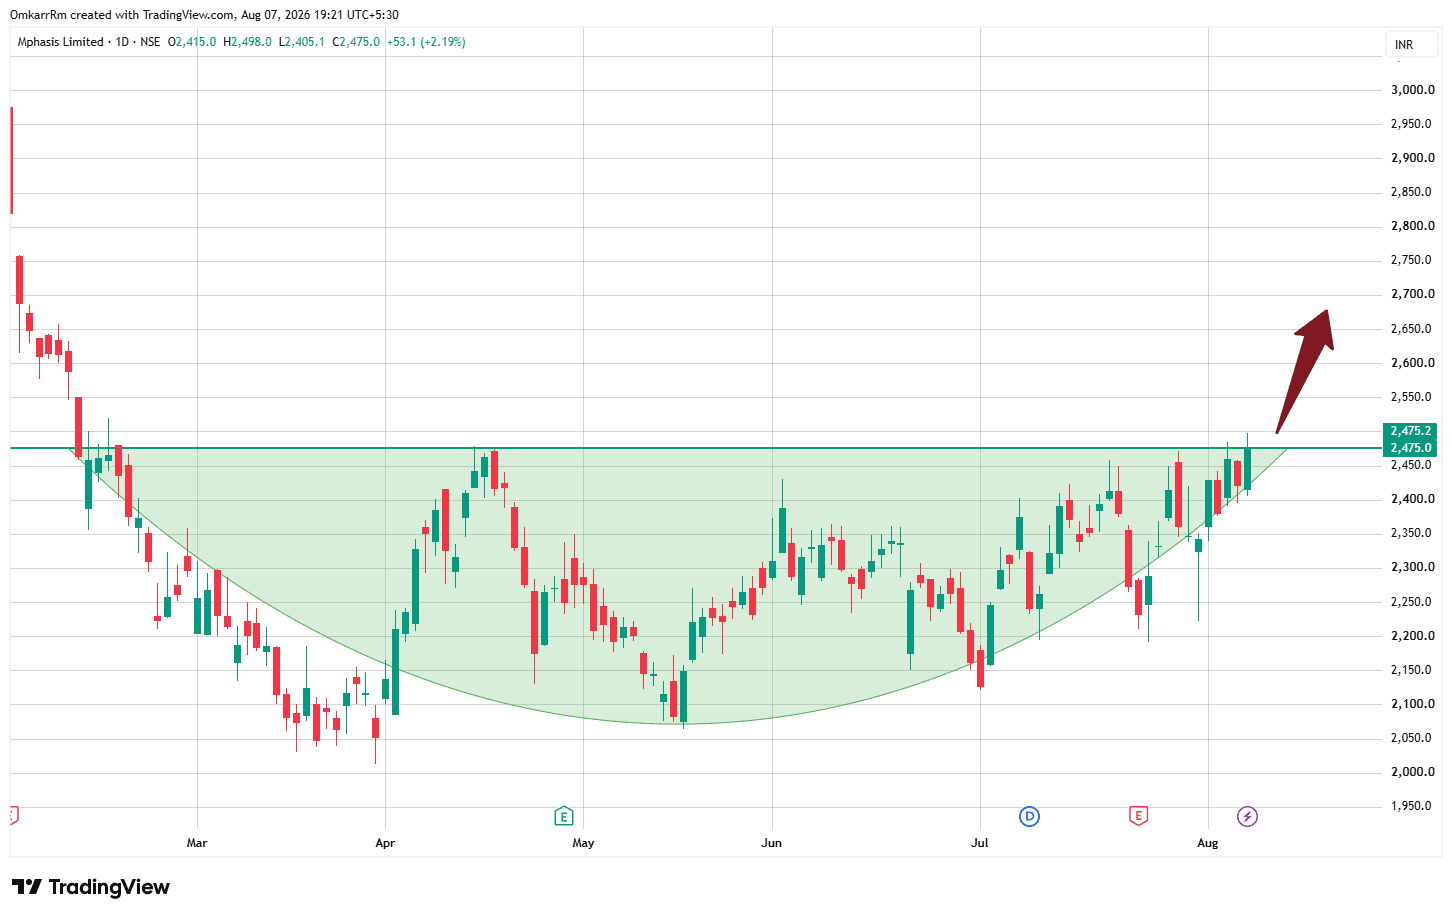
!MPHASIS What I see Timeframe: Daily CMP: ~₹2,475 Major resistance: ₹2,470–2,480 (being tested now) Pattern: Large rounding base (almost a Cup pattern) Trend: Higher highs and higher lows since July. Moving Averages: Price above 26 EMA. 26 EMA above 52 EMA. Both EMAs are sloping upward. Strong bullish alignment. Breakout Analysis The stock has returned to the same resistance where it was rejected in February. This is important because: Previous sellers around ₹2,475 have now largely been absorbed. Price has spent several sessions consolidating just below resistance instead of getting rejected. That usually indicates accumulation rather than distribution. The resistance has been tested multiple times, making it weaker. Cup Projection Approximate cup depth: Resistance ≈ ₹2,475 Cup bottom ≈ ₹2,050 Depth = ₹425 Measured target: ₹2,475 + ₹425 = ₹2,900 So the classical pattern target lies around: ₹2,850–2,950 Near-term Targets If breakout sustains: Target 1: ₹2,560 Target 2: ₹2,700 Target 3: ₹2,850–2,900 What would invalidate it? A failed breakout would be: Closing back below ₹2,430–2,440 High-volume bearish rejection from ₹2,475 As long as price stays above the breakout zone, the bullish structure remains intact. Relative Strength Compared with many IT stocks: TCS is only attempting a range breakout. Infosys has already moved. Coforge has rallied sharply. Mphasis is just entering the breakout phase, which often offers a better risk-reward than chasing stocks that have already extended. Bullish: 8.8/10 This is a technically attractive setup with: ✅ Multi-month rounding base ✅ Resistance being challenged repeatedly ✅ Bullish EMA alignment ✅ Potential measured move toward ₹2,900 The key confirmation now is a decisive daily close above ₹2,475 with above-average volume. That would significantly increase the probability of the next leg higher.