โ€น All Posts
CA Omkar Bhutada - SEBI Reg IA

23rd Jul 2025 ยท SEBI-Registered Analyst

๐Ÿ“Š Thomas Cook (India) Ltd โ€“ Technical Analysis (Weekly Chart)

THOMASCOOK
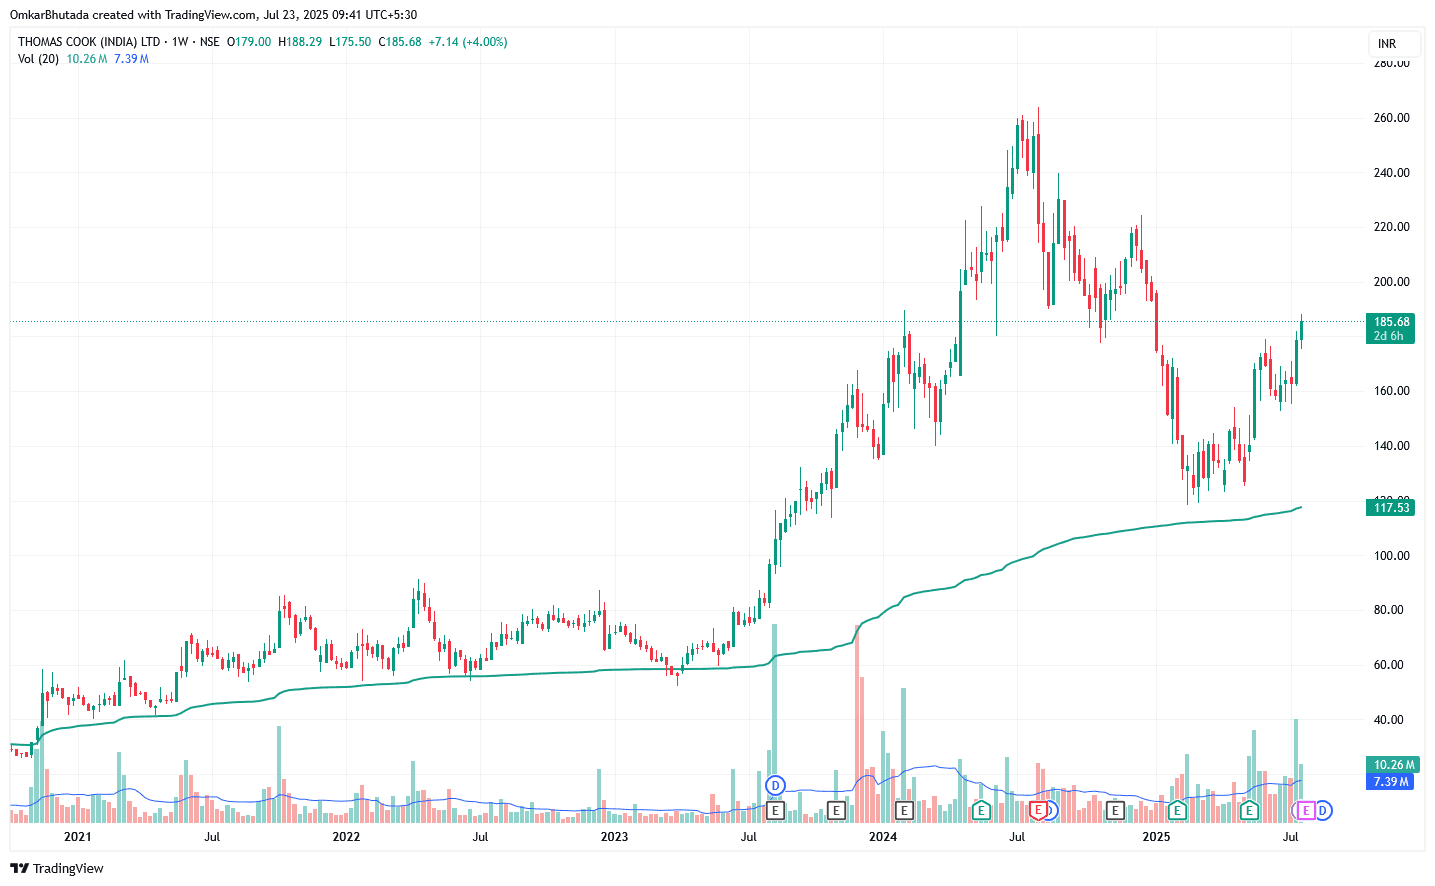
๐Ÿ“ Current Price: โ‚น185.68 Weekly Gain: +4.00% 200-Week EMA: โ‚น117.53 Volume: 10.26M (well above 20-period avg of 7.39M) ๐Ÿ“ˆ Technical Highlights โœ… 1. Trend Structure Strong uptrend since mid-2023. A sharp correction from highs near โ‚น275 to โ‚น120. Now, forming a V-shaped recovery โ€” a bullish signal showing regained momentum. โœ… 2. Demand Zone Respected The โ‚น120โ€“โ‚น135 range acted as a major demand zone (tested multiple times). From that zone, the stock has bounced sharply with consistent green candles. ๐Ÿ”„ 3. Resistance to Watch โ‚น190โ€“โ‚น200: Minor resistance zone. โ‚น225โ€“โ‚น240: Bigger hurdle (previous highs). A breakout above โ‚น240 would signal a move toward all-time highs again. ๐Ÿ” 4. Moving Average Analysis Price is well above the 200-week EMA (โ‚น117.53), reinforcing long-term bullishness. The slope of the EMA is upward, indicating sustained trend strength. ๐Ÿ“ฆ 5. Volume Confirmation Weekly volumes are strong with increasing participation on green candles โ€” accumulation visible.

#WatchOutFor#Todayโ€™sTradingSetup#FundamentalViews#TechnicalViews#EquityResearch
THOMASCOOK_2025-07-23_09-41-55.png
646 likesยท77 comments