
Currency Grow (CA & SEBI Reg IA Omkar Bhutada) · 22nd Feb
Vardhman Textiles Limited (Weekly Chart)
VTL
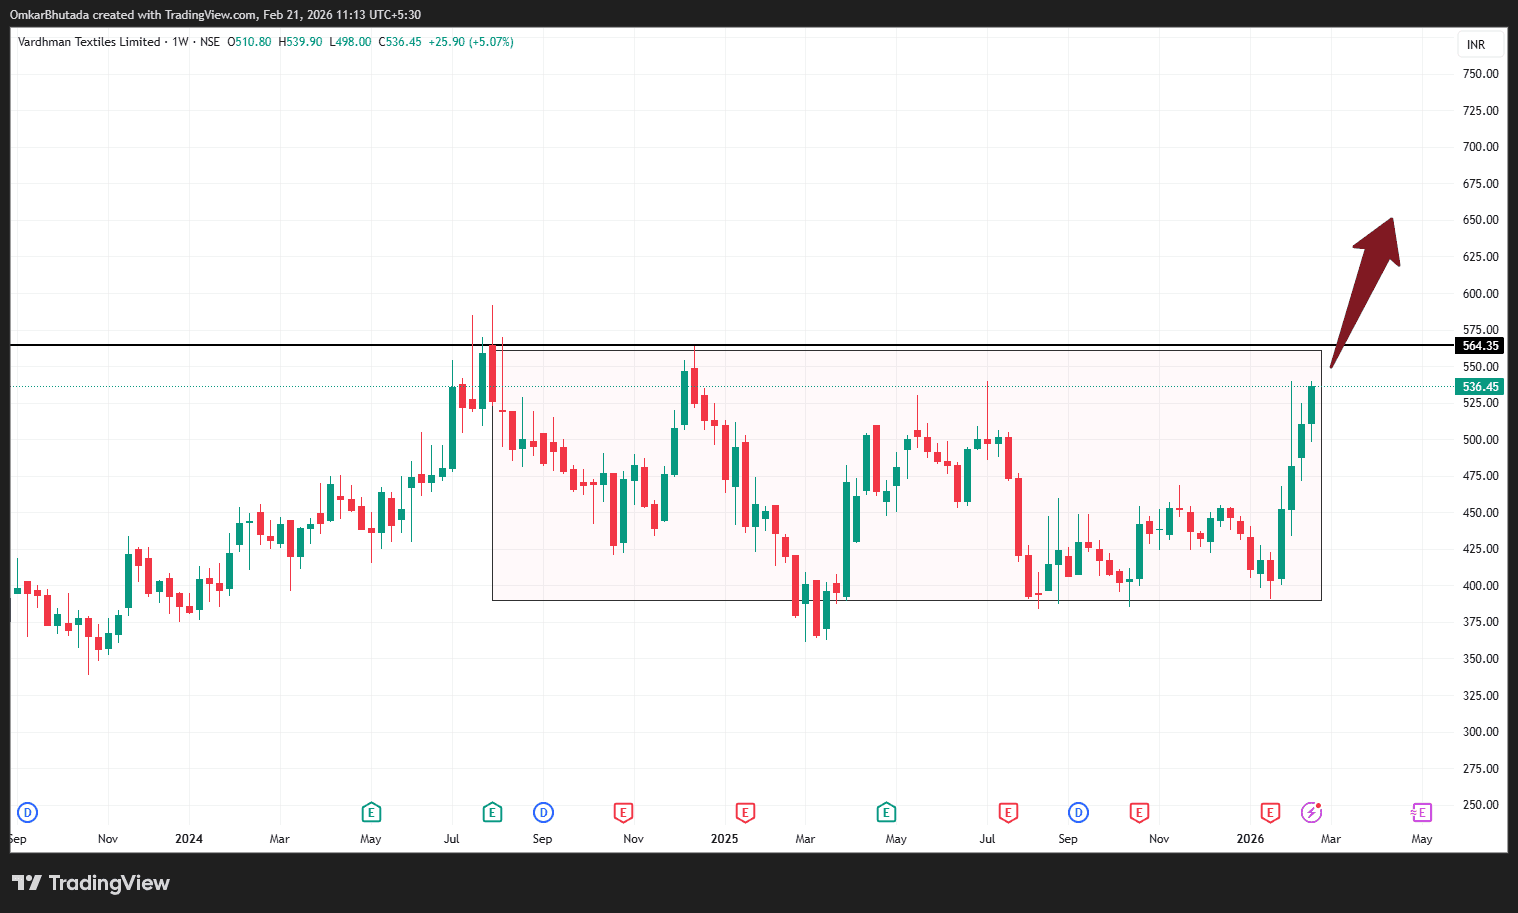
Multi-Year Consolidation → Breakout Attempt Above Major Supply
CMP: ₹536
Major Resistance: ₹560–₹575
Structure: Range Breakout in Progress
🧱 Structure Analysis (2-Year Range)
Price was stuck inside a broad rectangle:
Upper band: ₹560–₹575
Lower band: ₹380–₹400
Repeated rejections from ₹560 zone (2024 & 2025).
Now price is again approaching this ceiling with strong bullish candles.
This is a third-time test → probability of breakout increases.
🌊 Elliott Wave Perspective
Likely structure:
Wave (A): ₹575 → ₹380
Wave (B): ₹380 → ₹540
Wave (C): ₹540 → ₹400 (completed correction)
Now possibly starting Wave (1) of new impulse cycle.
If breakout sustains, medium-term structure targets:
🎯 ₹650
🎯 ₹720
📊 Momentum & Behaviour
✔ Strong bullish weekly candles
✔ Higher lows from ₹400
✔ Demand visible near ₹420–₹430
✔ Volatility contraction before expansion
This looks like accumulation → expansion phase.
🔑 Key Level: ₹575 (Neckline)
Two clear scenarios:
✅ Weekly Close Above ₹575
→ Confirmed structural breakout
→ Target ₹650–₹700 zone
→ Momentum traders enter
❌ Rejection Near ₹560
→ Pullback to ₹480–₹500
→ Retest before fresh breakout
📉 Support Zones
₹500
₹460
₹420
Invalidation: Sustained weekly close below ₹400.
🏭 Fundamental Context
Company is:
• Integrated textile manufacturer
• Strong presence in yarn & fabrics
• Export exposure
Textile cycle has been under pressure due to:
Cotton price volatility
Global demand slowdown
If global demand revives → operating leverage kicks in.
This can lead to strong earnings expansion.
🎯 Risk–Reward View
Aggressive traders:
Position on breakout above ₹575.
Conservative:
Wait for breakout + retest.
This is not a late rally — it’s a base breakout setup.