
‹ All Posts
CA Omkar Bhutada - SEBI Reg IA

25th Dec · SEBI-Registered Analyst

🧪 Vishnu Chemicals – Weekly Chart Breakdown (Very High Quality Setup)
VISHNU
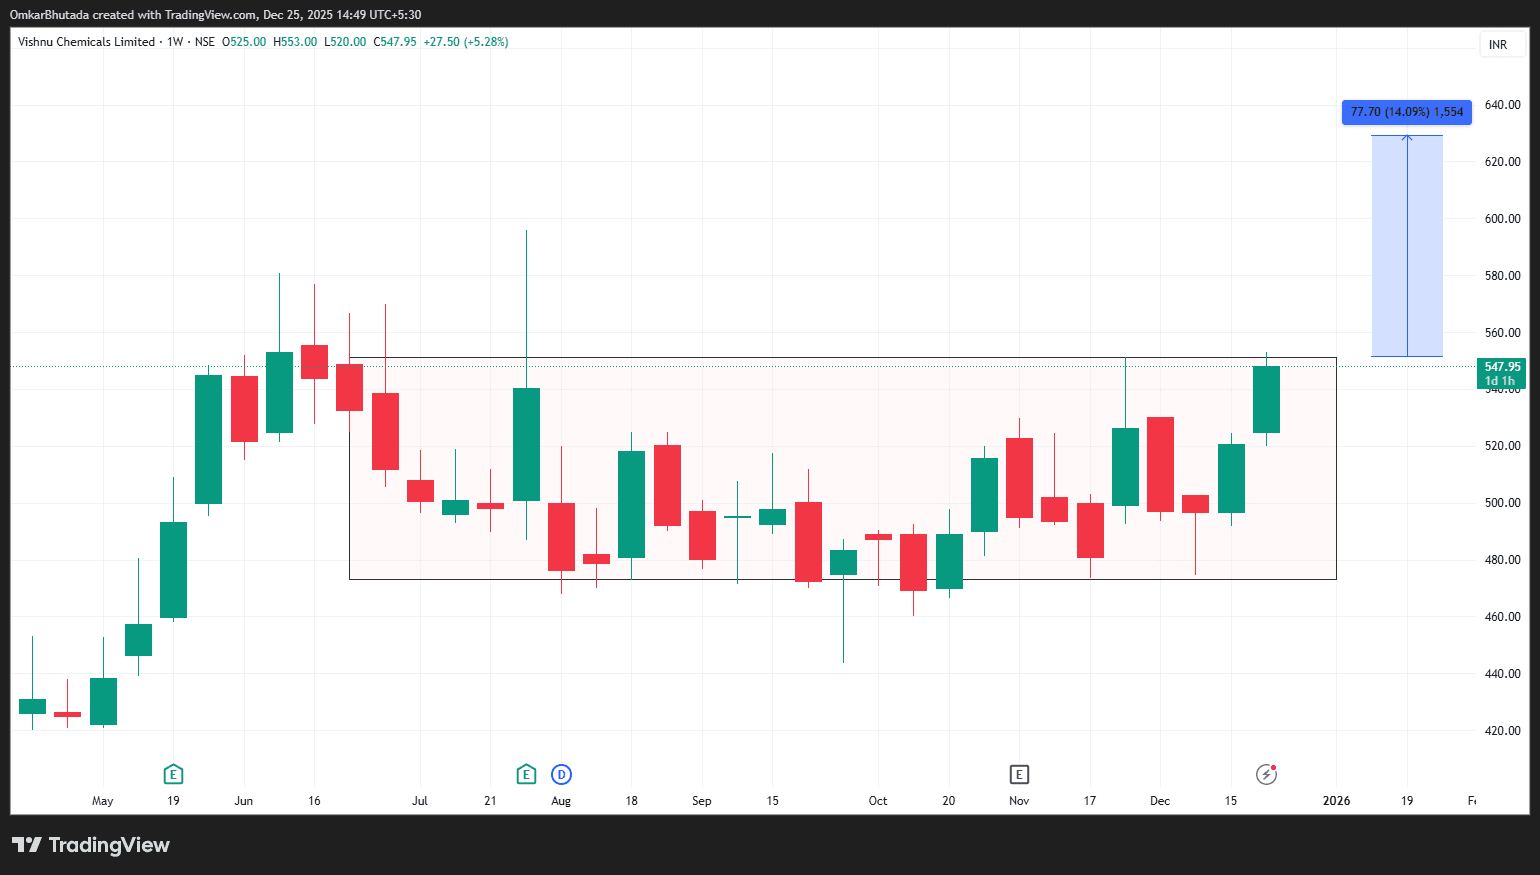
🧠 What the Chart Shows 🔹 Structure: Long Rectangle / Box Accumulation Range roughly ₹475 – ₹550 Time spent inside box: ~6–7 months Every dip bought → strong absorption This is smart-money accumulation, not retail chop. 🔑 Critical Levels Level Meaning ₹550–555 Box high / breakout trigger ₹520–525 Immediate retest support ₹480–490 Strong demand base ₹625–635 Pattern target ₹680+ Momentum extension 📐 Target Calculation (Your Projection is Perfect) Range height ≈ ₹75–80 Breakout point ≈ ₹550 🎯 Measured move = ₹625–630 (Exactly what you’ve marked on the chart ✔) 📊 Price Action Confirmation (Very Important) Latest weekly candle: strong green close near high No upper rejection → sellers not defending ₹550 Breakout coming after time correction, not after vertical run This dramatically improves sustainability of the move.

#StockInNews#WatchOutFor#Today’sTradingSetup#FundamentalViews#TechnicalViews
VISHNU_2025-12-25_14-49-18.png
711 likes·67 comments