
โ€น All Posts
CA Omkar Bhutada - SEBI Reg IA

28th May 2025 ยท SEBI-Registered Analyst

๐Ÿš€ Wave 3 Potential on Fundamentally Strong Midcap!
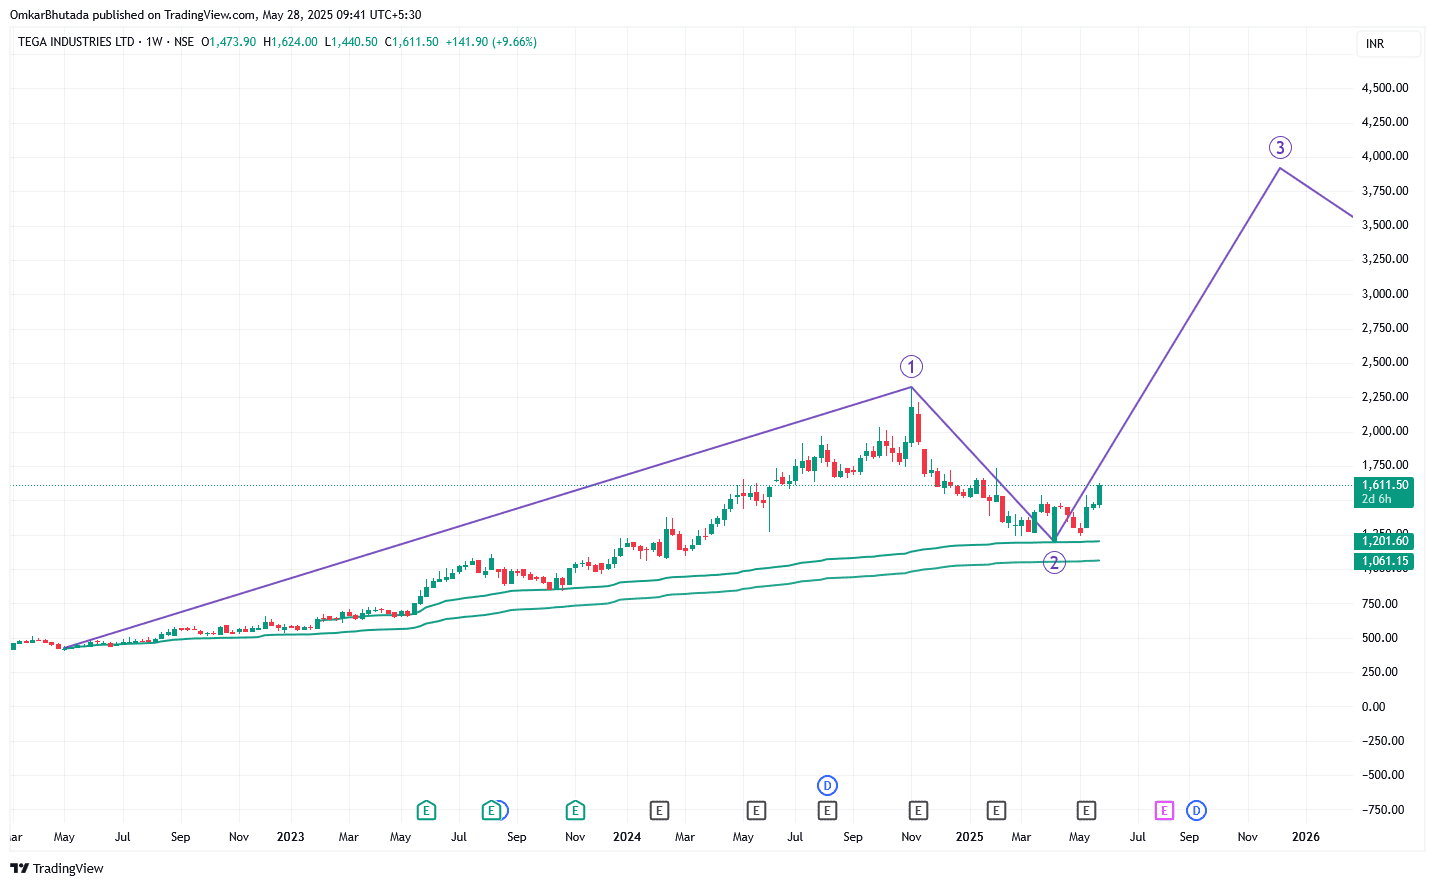
TEGA
๐Ÿ” Technical + Fundamental Breakdown (TEGA Industries Ltd | Weekly Chart) โœ… Elliott Wave Structure: The chart clearly depicts the completion of Wave 1 and Wave 2 correction. Current price action marks the early stage of Wave 3, which is typically the strongest and longest wave in Elliott theory. Price rebounded from the support zone between โ‚น1,060โ€“โ‚น1,200, aligning with long-term EMAs. โœ… MACD Signal: The MACD line is crossing above the signal line, coming out of deep oversold territory. This transition suggests momentum shift in favor of bullsโ€”classic early Wave 3 confirmation. โœ… Anchored VWAP & EMA Levels: 200 EMA and Anchored VWAP from the major bottom have acted as springboards. Price reclaiming above these zones indicates strong base-building and renewed institutional interest. โœ… Fundamental Strength Snapshot: ROCE > 22% over the last 3 years Debt-free balance sheet Consistent revenue and profit growth, driven by robust export demand and specialized industrial offerings Positioned strongly in the mining consumables segment, which has secular tailwinds ๐Ÿง  Summary: TEGA Industries is forming a textbook Wave 3 launchpad, supported by: Elliott Wave alignment MACD bullish crossover Strong fundamental and financial backdrop Watch Zone: โ‚น1,600โ€“โ‚น1,700 Wave 3 Target Zone: โ‚น3,800โ€“โ‚น4,200 Risk Level: Medium (Invalidation below โ‚น1,350)

#WatchOutFor#TechnicalViews#FundamentalViews#EquityResearch
TEGA_2025-05-28_09-42-00.png
223 likesยท73 comments