22nd Jun · SEBI-Registered Analyst
Currency Grow (CA & SEBI Reg IA Omkar Bhutada) · 22nd Jun
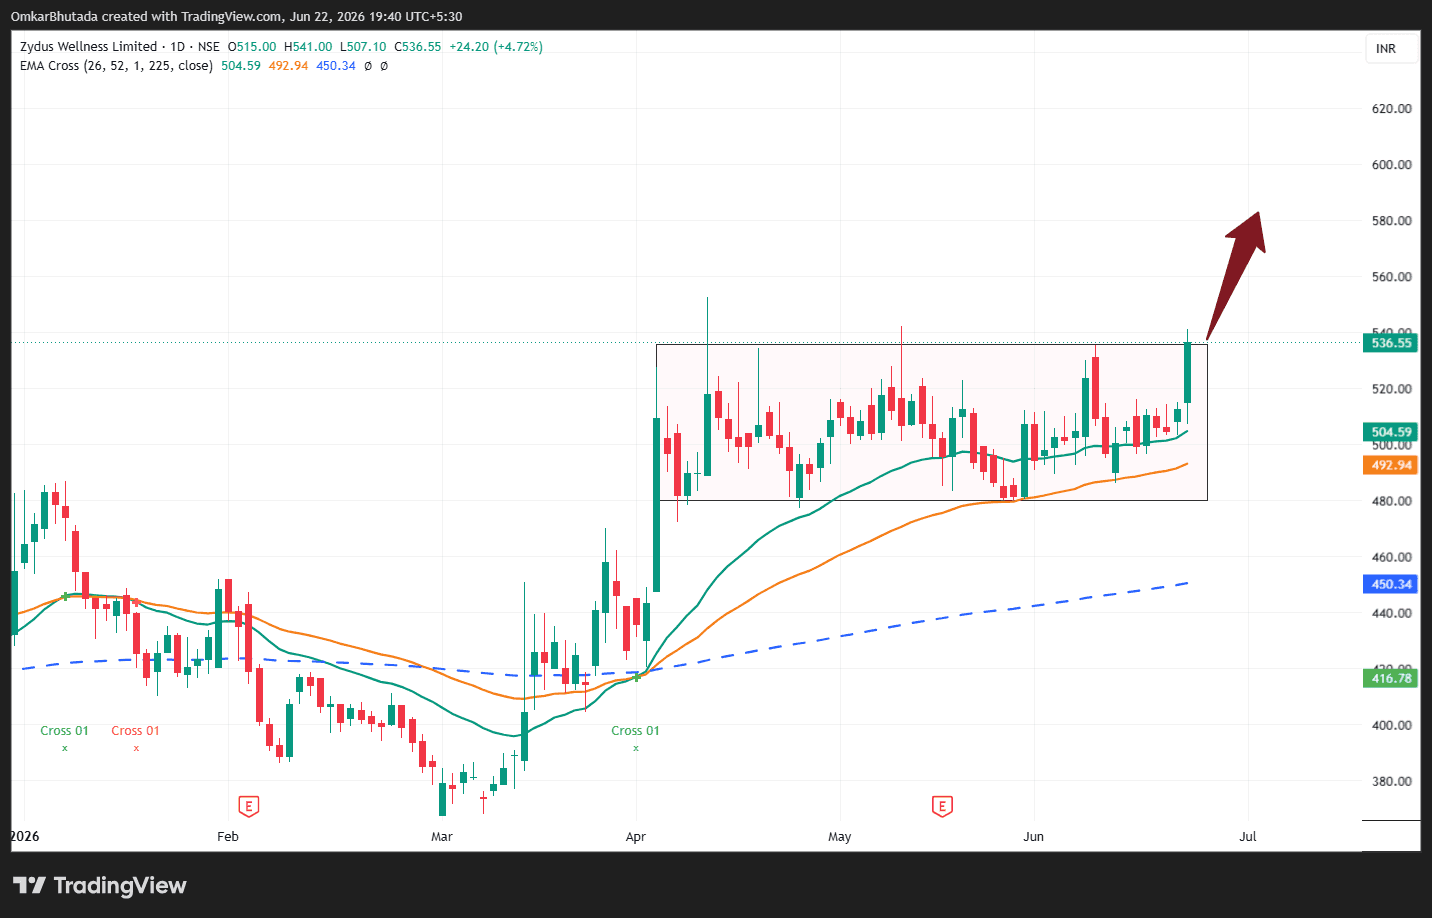
Zydus Wellness – Daily Chart Analysis
$ZYDUSWELL This is one of the cleanest rectangle consolidation breakouts you've shared. What the Chart is Showing Phase 1: Trend Reversal Stock bottomed around ₹370–380. Strong rally to ₹530–540. EMA 26 crossed above EMA 52. Price is trading well above the 225 EMA. This confirms a primary uptrend. Phase 2: Consolidation For nearly 2 months price moved between: Resistance: ₹538–540 Support: ₹480–485 This formed a classic rectangle/base pattern. The longer the base, the stronger the eventual move. Phase 3: Breakout The latest candle has: ✅ Closed at the resistance zone. ✅ Made a fresh swing high. ✅ Closed above all major EMAs. ✅ Broken a multi-week consolidation. This is exactly the type of setup institutions accumulate before the next leg higher.