📌 Mahindra Finance — Short-Term Price Action View 🔍
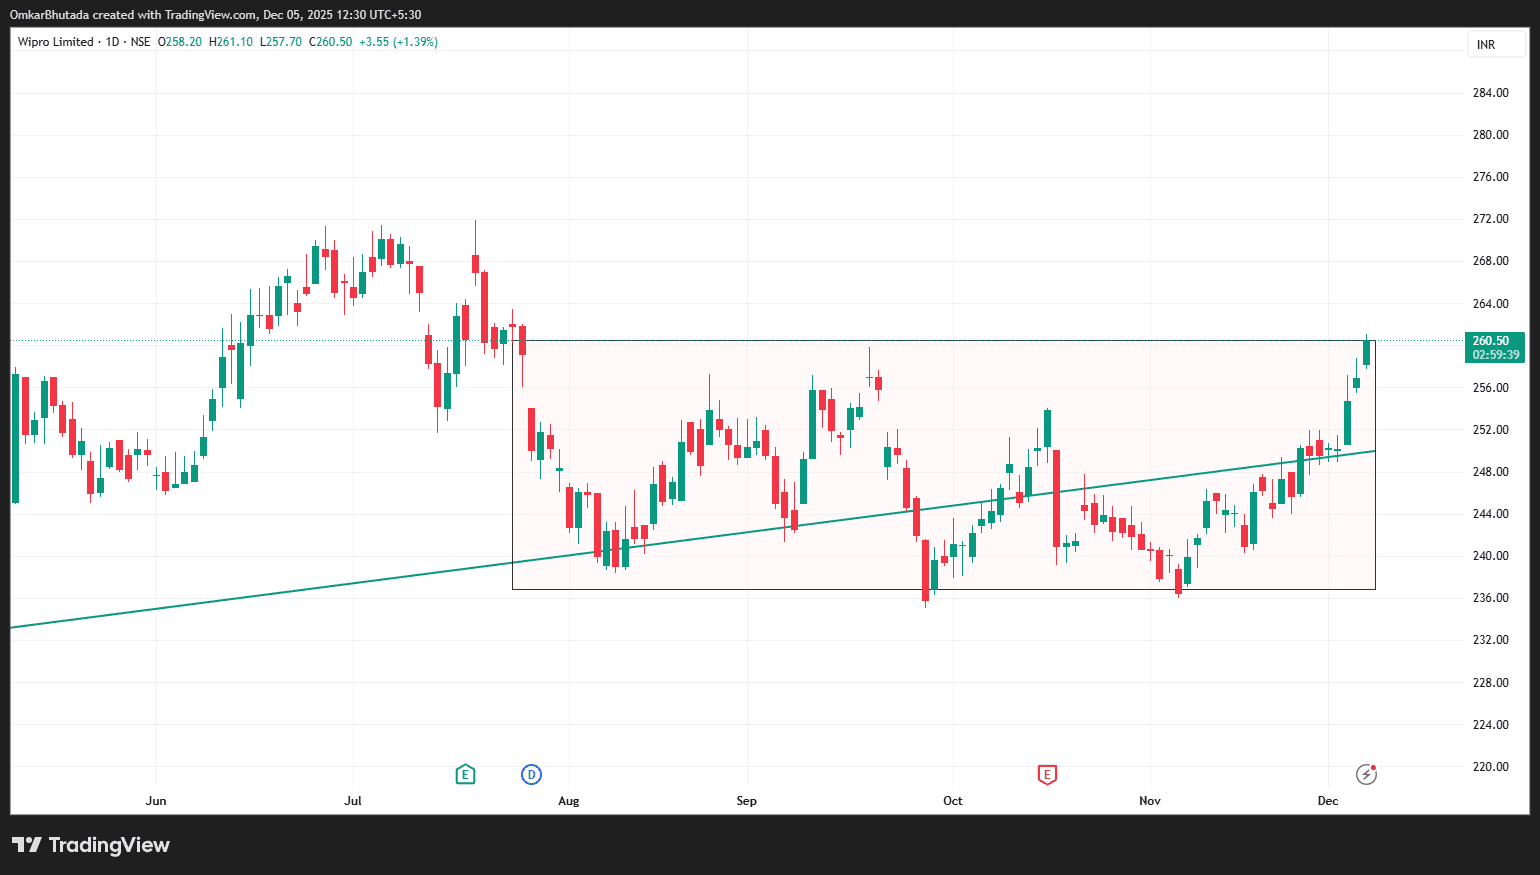
M&MFIN This chart shows a clear mini range formation after a strong upside rally — a pattern often referred to as a: Bullish Consolidation / Bull Flag Base 🧠 What’s happening right now? The stock moved up sharply before entering a sideways box. This sideways price action is not a reversal — it’s a pause. Buyers are defending the lower zone, sellers are active near the top → balance of forces before the next move. 🧩 Candle Psychology The latest strong green candle from the lower boundary signals: ✔️ Buying interest ✔️ Demand absorption ✔️ Possible attempt to retest resistance If the stock sustains above the midpoint (~₹360–₹365), the probability of a breakout increases. 🎯 Expected Behaviour 📍 If price breaks and closes above ₹372: ➡️ Upside continuation possible with momentum push as trapped sellers exit and new breakout buyers enter. 📍 If price rejects resistance and falls below ₹346: ➡️ The range remains intact — just more time, not weakness. 📍 Breakdown only below ₹340: ➡️ Structure shifts from consolidation to weakness. 🚀 Summary This is classic: "Post-rally sideways absorption → breakout candidate." Not a trade yet… but definitely a watchlist setup — waiting for confirmation.