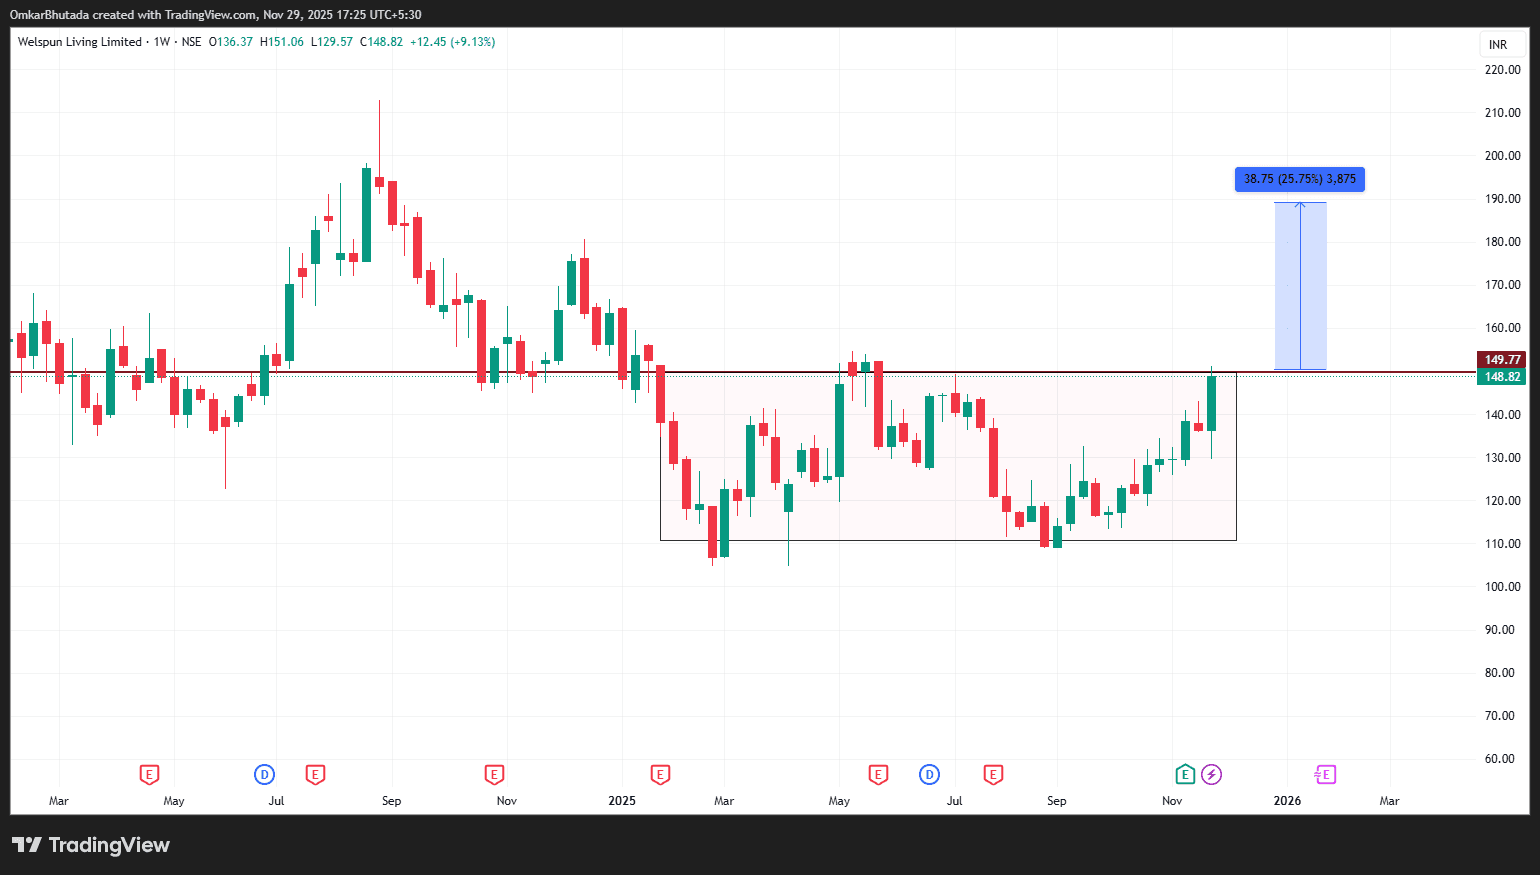
🚀 Range Breakout on Weekly Chart – Momentum Building!
WELSPUNLIV This stock has been consolidating in a sideways structure for several months, and now price action is finally attempting a decisive breakout above a major resistance zone — signalling a potential shift from accumulation to upward expansion. 📊 Technical Structure Breakdown 📌 Range Zone: ₹112 – ₹150 📌 Breakout Attempt: Price is currently pushing above the ₹149–₹150 resistance, which has acted as a ceiling multiple times in the past. 📌 Volume Behaviour: Recent candles show improving sentiment, suggesting renewed participation after months of indecision. The longer the consolidation, the stronger the move once the breakout is confirmed — and here the range lasted several months, adding conviction. 🎯 Price Projection If the breakout sustains above ₹150 with a clean weekly close: ➡️ Measured Move Target: approx. ₹185–₹190 This aligns with the height of the accumulated zone and the percentage projection shown on the chart — nearly 25–26% upside potential from current breakout levels. 📌 Key Levels to Track Breakout Validation Zone: ₹149–₹150 Retest Support (If Pullback Happens): ₹140–₹145 Trend Confirmation: Higher highs and higher lows on the weekly structure 🧠 Market Context Insight This setup reflects a transition from: Sideways Consolidation → Breakout Phase → Potential Trend Continuation Such moves often attract momentum traders after confirmation, leading to trending structure if price holds above resistance.