


21st Feb 2025 · SEBI-Registered Analyst
Finversify with Dhwani Patel ,CMT · 21st Feb 2025
CANFINHOME - Long term bottom or Breakdown - A study
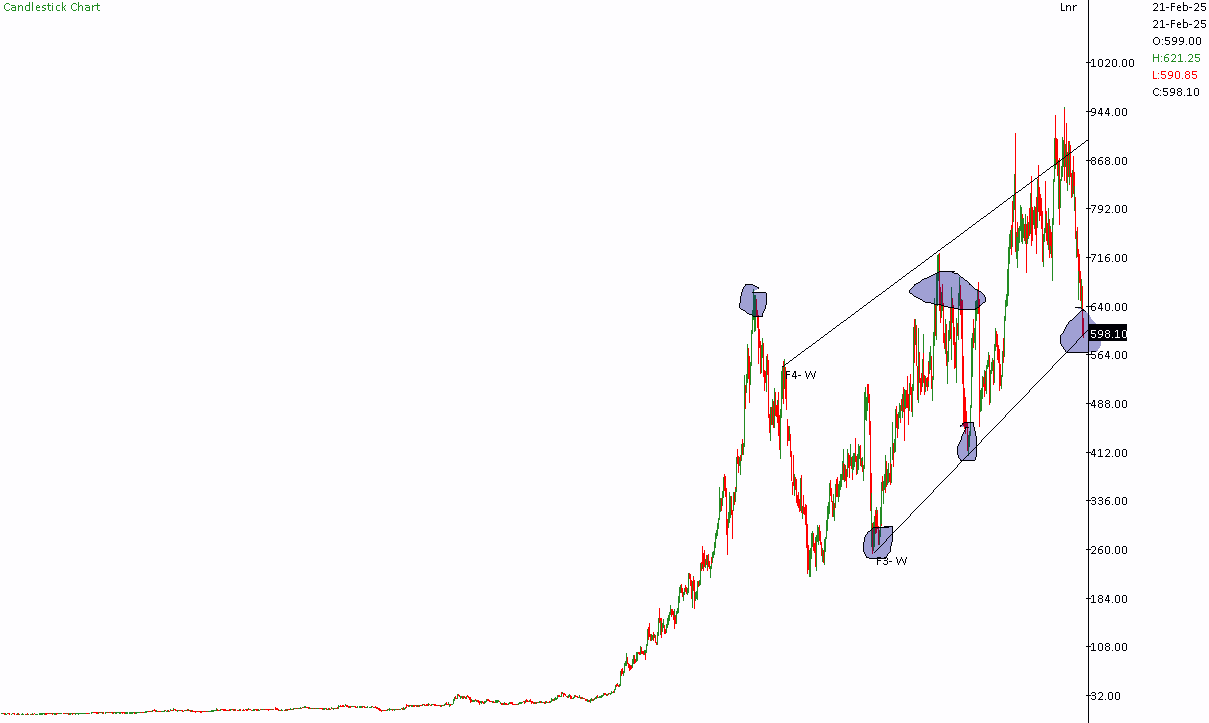
This is one of the best charts we can look at.
1 - long term uptrend as stock went from 111 to 900 levels
2- it has tested upward line of channel and now it is at lower support trendline
3- it may make a strong bottom and reverse to 900
4 - if it breaks we may see 400 levels in CANFINHOME
5 - The pattern is upward channel
#StockInNews#TechnicalViews#TrendingSectors#PsychologyofMoney
219 likes·52 comments