Coal India: 4-Hour Chart Shows a Recovery Above the Cloud
COALINDIA
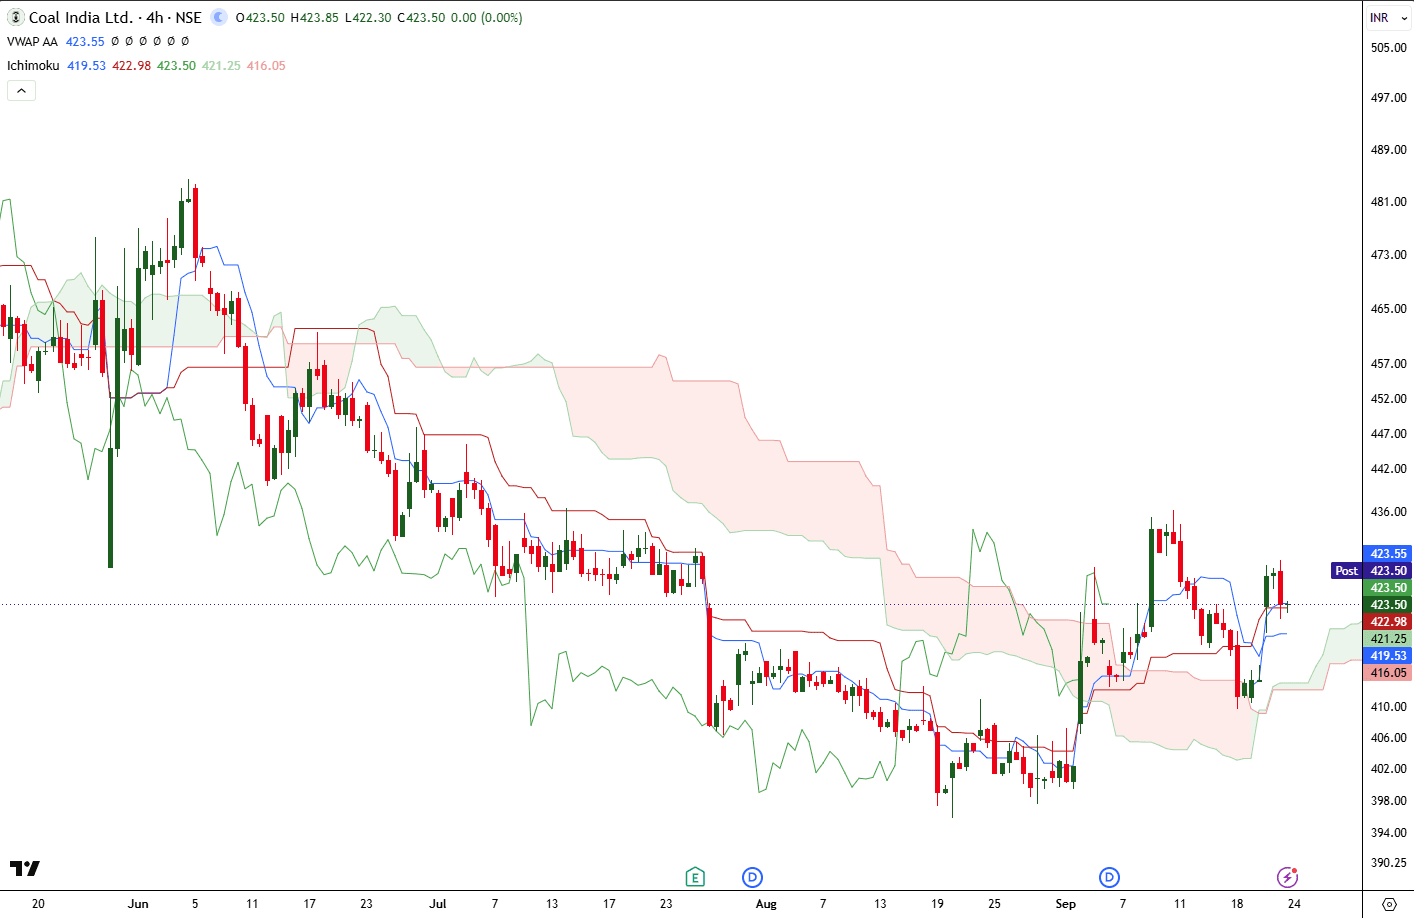
at ₹424.55 on the 4-hour chart, down 0.74% in the latest candle. After falling towards ₹400 in late August, the stock has formed a recovery sequence with higher lows and has moved back into the ₹420–₹430 range.
The Ichimoku indicators are currently constructive on this shorter timeframe. Price is above the anchored VWAP at ₹423.53, which means it is holding above the average cost of recent trade. It is also above the Tenkan-sen at ₹419.53 and the Kijun-sen at ₹422.98. When price holds above both lines, the faster line becomes short-term support while the Kijun acts as the more important equilibrium level.
The cloud is below the current price, roughly between ₹416.05 and ₹421.25. This is significant because the cloud has changed from an overhead resistance zone into a support area. A pullback that holds above ₹421 would keep the recovery structure healthy. The lagging span is also no longer deeply buried under prior price action, which suggests the selling pressure seen in August has eased.
₹430–₹435 is the immediate resistance zone, where the stock recently faced supply. A sustained move above ₹435 could open the path towards ₹440 and then ₹445. On the downside, ₹423 is the first support through VWAP and Kijun-sen. Below that, ₹421 and ₹416 are the more important supports. A close below ₹416 would place the stock back inside the cloud and weaken the recovery.
Coal India’s dividend profile and domestic coal-demand exposure remain important fundamental factors. Technically, the short-term chart is improving, but a move above ₹435 would provide the stronger confirmation that the recovery has further room.