Coromandel International: Weekly Chart at a Decision Point
COROMANDEL
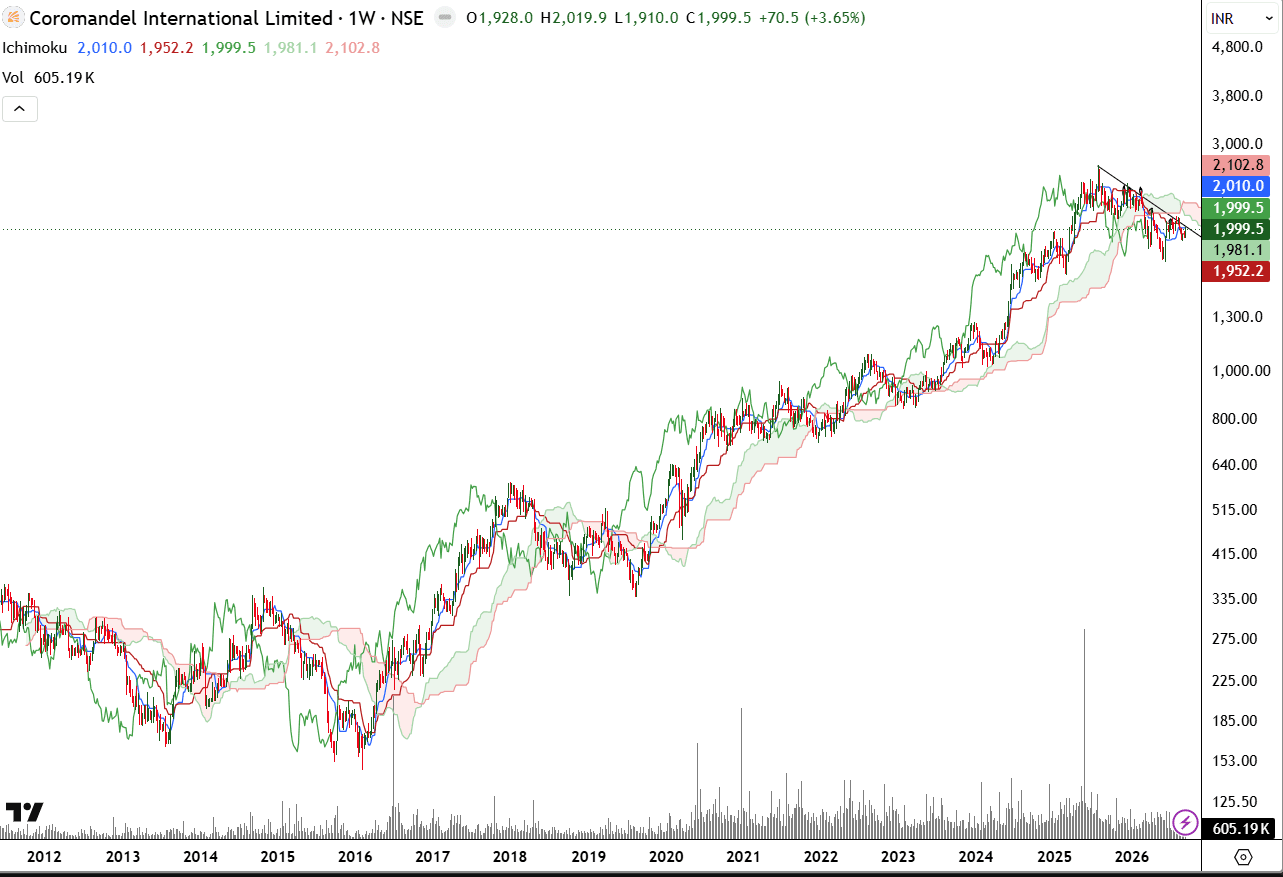
closed around ₹1,999.5 on the weekly chart, up 3.65%. The long-term trend remains constructive: the stock has risen substantially from its earlier base and continues to trade near the upper end of its multi-year range.
The current weekly structure, however, is in a decision zone. Price is sitting around the Ichimoku cloud, with the cloud roughly between ₹1,981 and ₹1,999.5. The Tenkan-sen is near ₹2,010, while the Kijun-sen is near ₹1,952. This means the stock has improving short-term momentum, but it has not yet cleared all of its overhead resistance.
A sustained move above ₹2,010 would be the first positive confirmation. The stronger breakout level is around ₹2,100, near the recent swing resistance and forward cloud boundary. Above that, the stock could resume its broader uptrend. On the downside, ₹1,981 is the first support, followed by ₹1,952. A weekly close below ₹1,952 would make the setup meaningfully weaker.
Coromandel’s position in fertilizers, crop protection and agricultural inputs gives the business a strong structural theme, but the chart is currently better described as a consolidation near support than a confirmed breakout. The key is whether price can reclaim ₹2,010 and then challenge ₹2,100.
Disclaimer - No Position