


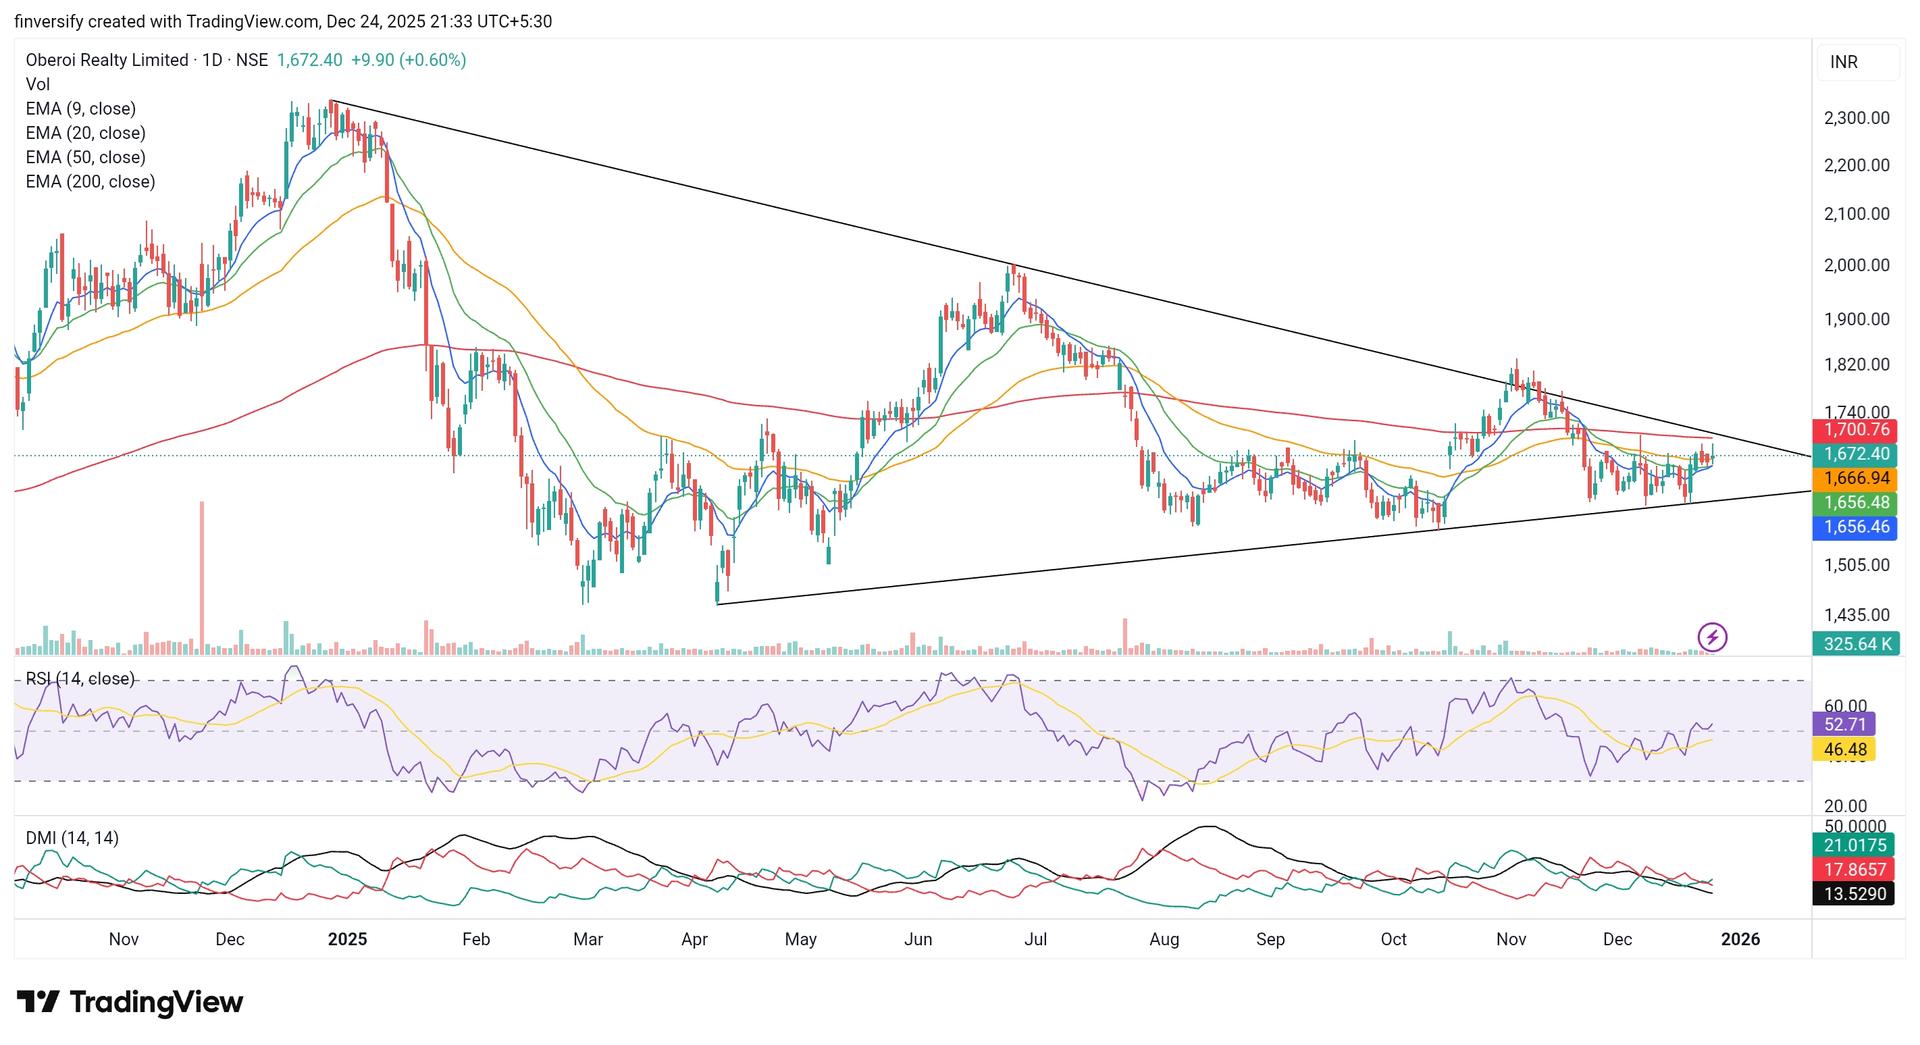
OBEROIRLTY Oberoi Realty Ltd daily chart illustrates a large symmetrical triangle after a prior decline, ideal for explaining volatility contraction, converging EMAs, neutral RSI, low ADX, and how breakouts from such compression often lead to strong moves, demanding strict risk management at apex.
#TechnicalViews#SectorBreakouts
640 likes·59 comments