


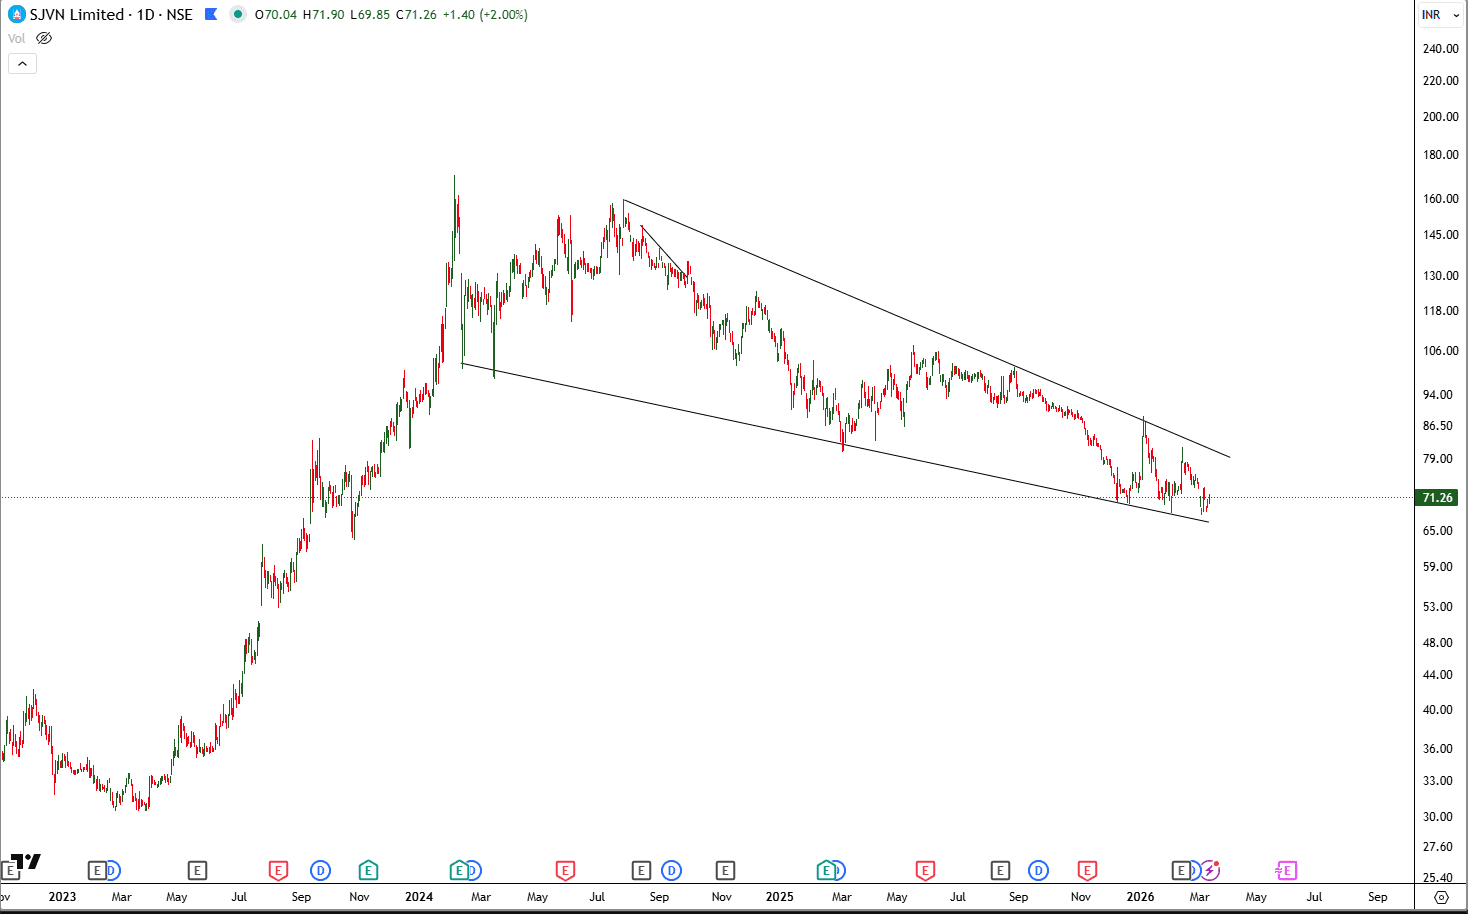
SJVN Falling wedge
A falling wedge is a bullish chart pattern that forms when price makes lower highs and lower lows but within two converging downward-sloping trendlines. The contraction in price range reflects weakening selling pressure, even though the trend still appears downward. A breakout above the upper trendline often signals a shift in momentum and the potential start of an upward move.
keep SJVN on radar
#Today’sTradingSetup#StockInNews#TechnicalViews
498 likes·62 comments