‹ All Posts
Dhwani Patel

20 mins ago · SEBI Registration INH200008608

Sun TV Network falls below its Ichimoku cloud
SUNTV
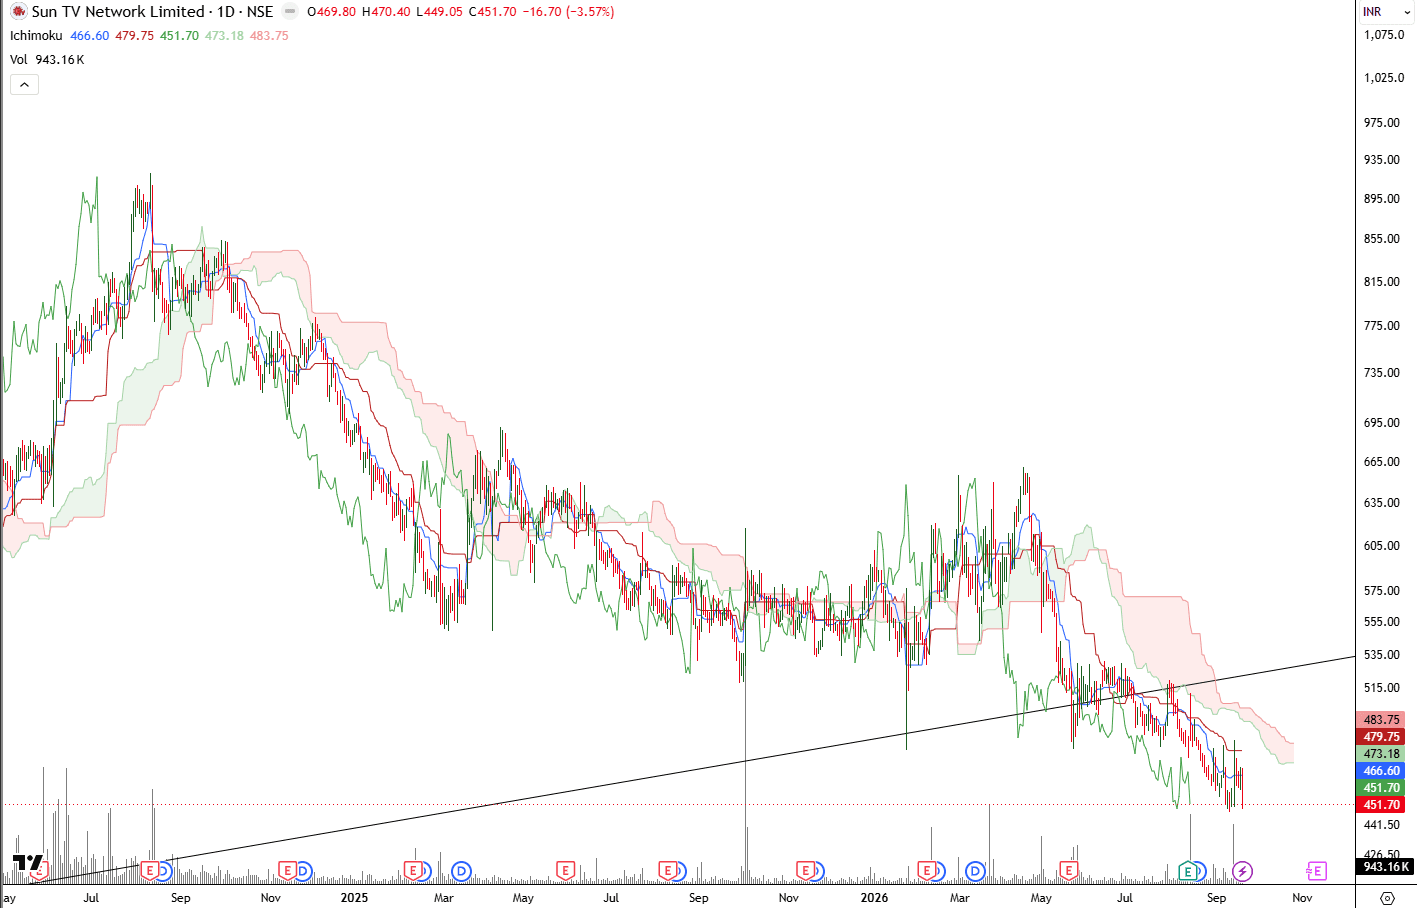
closed at Rs 451.70 on the daily chart, down 16.70 points or 3.57 percent. The stock is trading below its Ichimoku cloud and below both the conversion and base lines. What happened: Sun TV Network closed at 451.70, down 3.57 percent from the previous close, after opening at 469.80 and making a low of 449.05. The Tenkan-sen (conversion line) stands at 466.60 and the Kijun-sen (base line) at 479.75, both above the closing price. The Senkou Span A is at 473.18 and the Senkou Span B is at 483.75, placing price below both spans and outside the cloud. Why it matters: Price trading below the conversion line, the base line, and the cloud at the same time is a fully bearish Ichimoku alignment on the daily timeframe. The distance between Span A (473.18) and Span B (483.75) is around 10 points, which is a relatively narrow cloud, so it would not take an unusually large move for price to test it again, though the direction of that test still needs to be confirmed by price action. Analysis: The base line at 479.75 has been declining along with price for several sessions, which keeps the bearish structure intact rather than flattening out. A rising trendline is visible on the chart connecting the lows since mid-2024, and the current decline is approaching that line. Whether that trendline holds as support or gives way is the key question from here, since the Ichimoku picture alone is bearish until proven otherwise. What is being watched next: a close back above the Kijun-sen at 479.75 would be the first sign that the bearish pressure is easing. A break of the rising trendline visible on the chart, combined with price staying below the cloud, would add to the bearish case. Disclosure: No position is held in Sun TV Network Limited

#WatchOutFor#StockInNews#Today’sTradingSetup
Screenshot 2026-09-18 161356.png
3 likes