


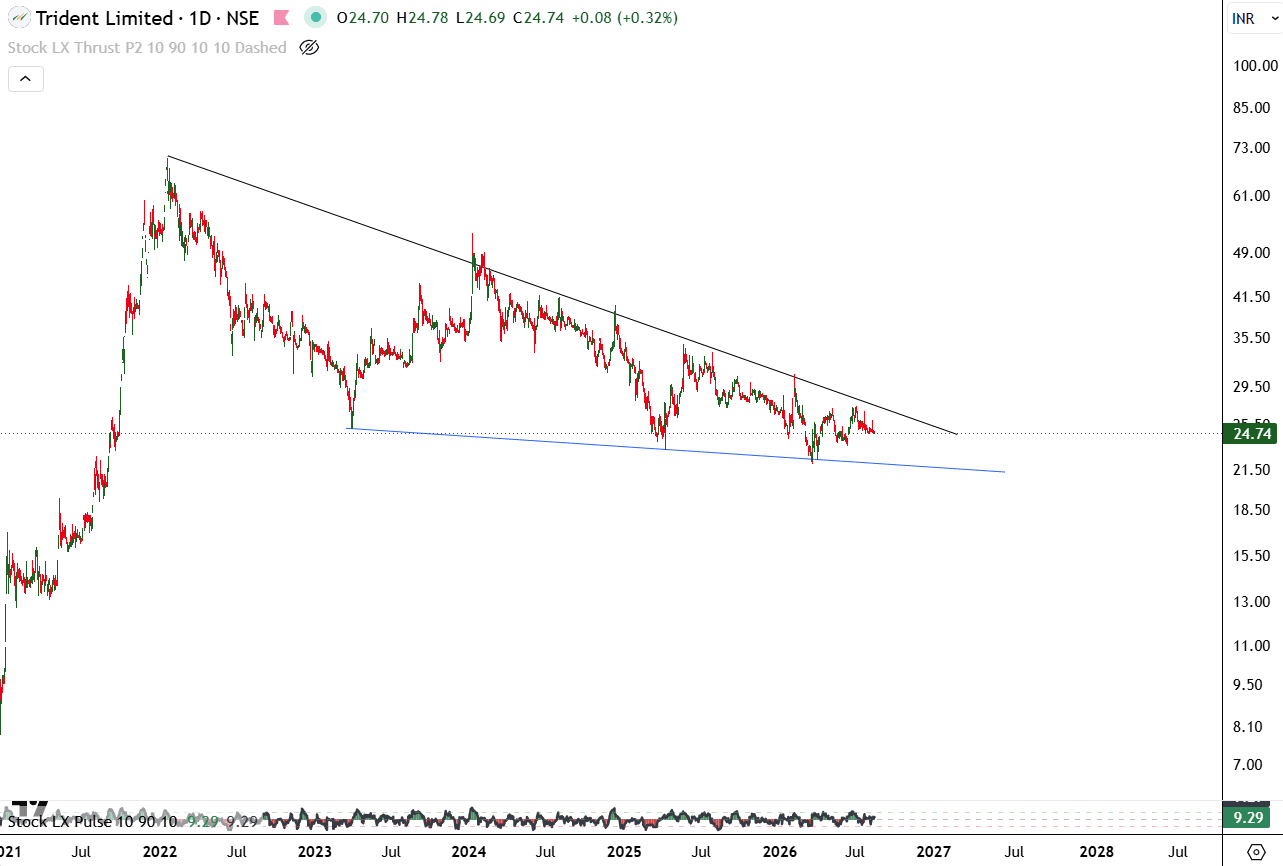
Trident - Falling wedge pattern
Trident is forming a falling wedge on the daily chart, with price compressing between a descending resistance trendline and a gradually declining support line.
A sustained breakout above the upper trendline would be the key bullish confirmation, while the ₹22–23 zone remains an important support area. Until the breakout occurs, keep an eye, TRIDENT
#PsychologyofMoney#Today’sTradingSetup#StockInNews
493 likes·79 comments