


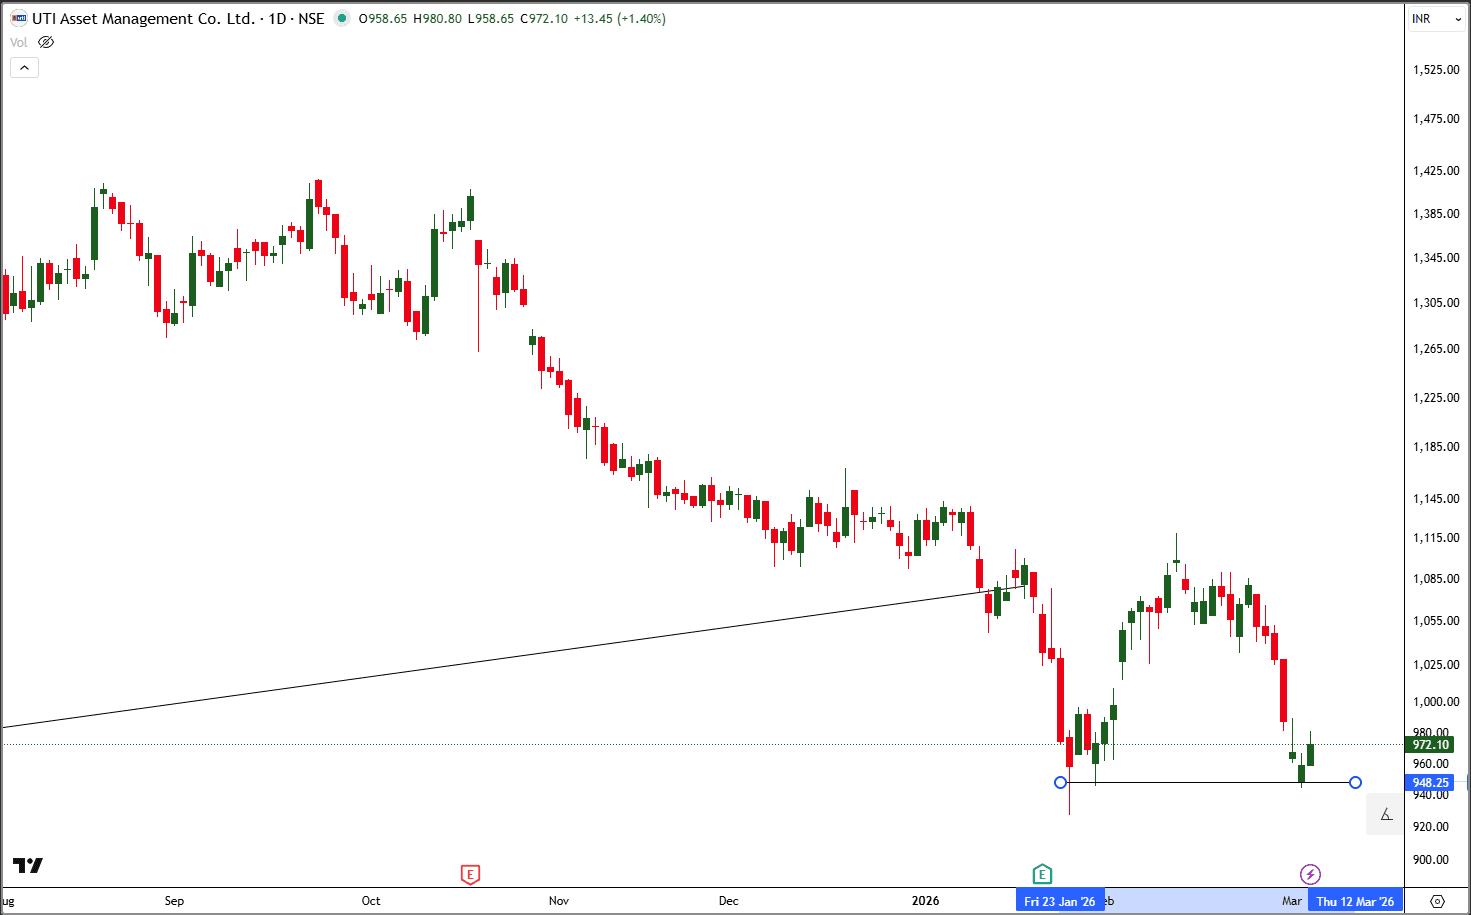
UTIAMC - Double bottom
A sharp double bottom is seen in UTIAMC at 950 levels. A double bottom is a bullish reversal chart pattern that forms after a downtrend when price makes two similar lows separated by a moderate peak. It indicates that selling pressure is weakening and buyers are starting to gain control. The pattern is confirmed when the price breaks above the resistance level (the peak between the two bottoms), often signaling a potential upward move.
keep an eye on UTIAMC
#HiddenGems#TechnicalViews#TrendingSectors
518 likes·69 comments