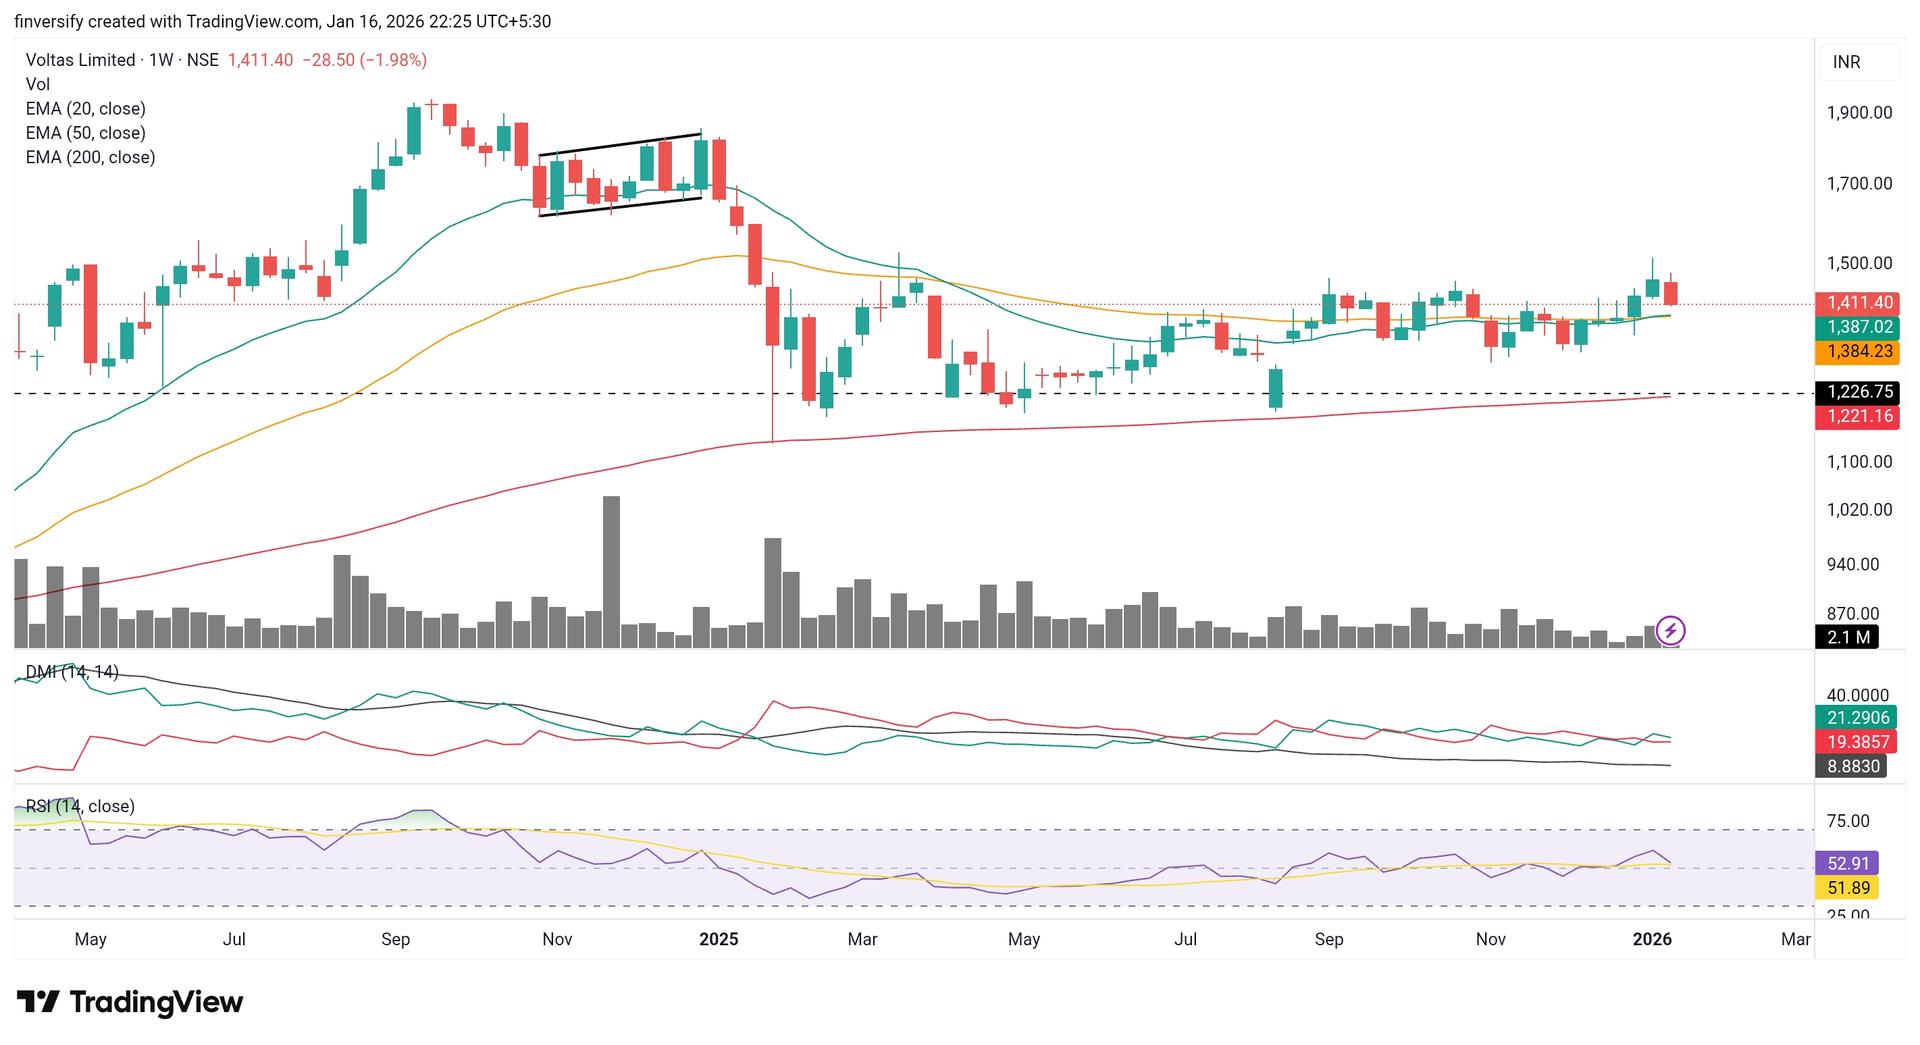
The weekly stock chart of Voltas Limited on the NSE shows a current price of ₹1,411.40, down 1.98%. It includes technical indicators such as EMA (20, 50, 200), DMI (14,14), and RSI (14). The RSI is at 52.91, indicating neutral momentum. The DMI values—green at 21.24, red at 19.39, and blue at 8.88—suggest a slight bullish bias. A consolidation phase is highlighted in mid-2025, possibly signaling accumulation before a breakout. Volume stands at 2.1 million, supporting active trading interest. The EMA lines show the price hovering above the 200 EMA, indicating long-term bullishness, while short-term EMAs suggest recent volatility. The chart spans from early 2024 to early 2026, offering a broad view of price action.
Overall, Voltas appears to be in a consolidation phase with potential for upward movement, supported by moderate RSI and directional indicators, though confirmation is needed for trend continuation.