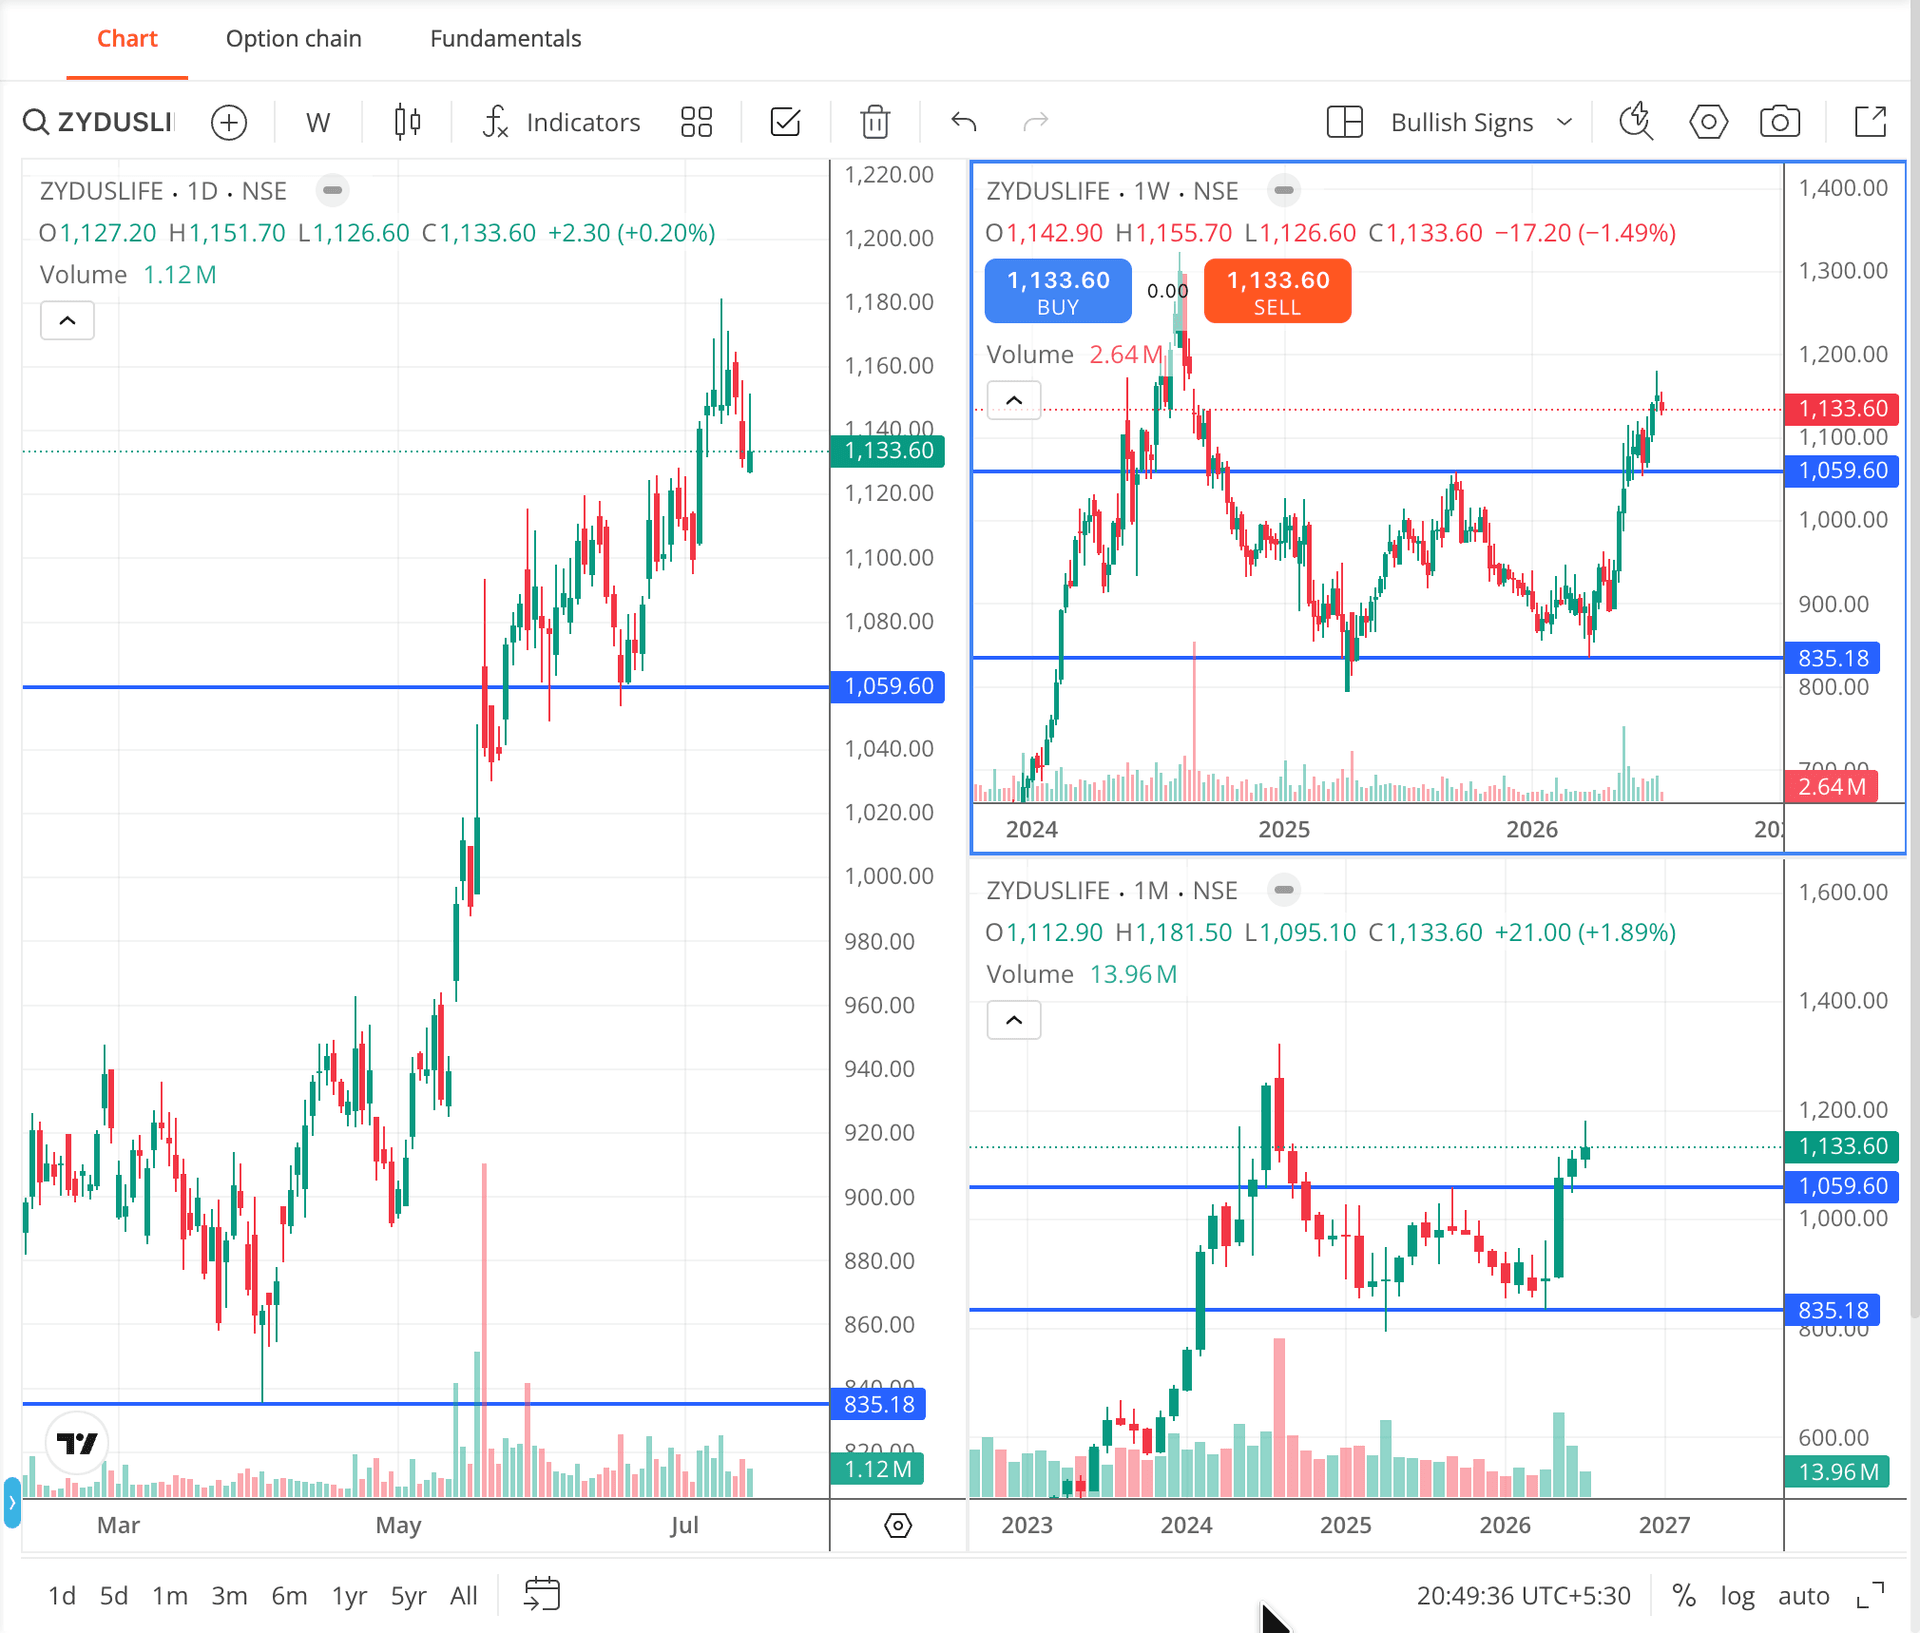
Understanding the Double Bottom Chart Pattern
Not every downtrend lasts forever. Before a trend reverses, the market often gives early signs that buyers are stepping in.
One of the most reliable bullish reversal patterns is the Double Bottom.
A Double Bottom forms when:
- Price finds support and rebounds.
- It pulls back to the same support level, but sellers fail to push it lower.
- Price then breaks above the neckline, confirming the bullish reversal.
This creates a "W" shaped pattern, indicating that buying momentum is gradually taking control.
How to trade it?
✔️ Identify two lows near the same support zone.
✔️ Draw the neckline using the swing high between the two bottoms.
✔️ Wait for a confirmed close above the neckline.
✔️ Higher breakout volume adds confidence to the setup.
Example
I have attached the Zydus Life (