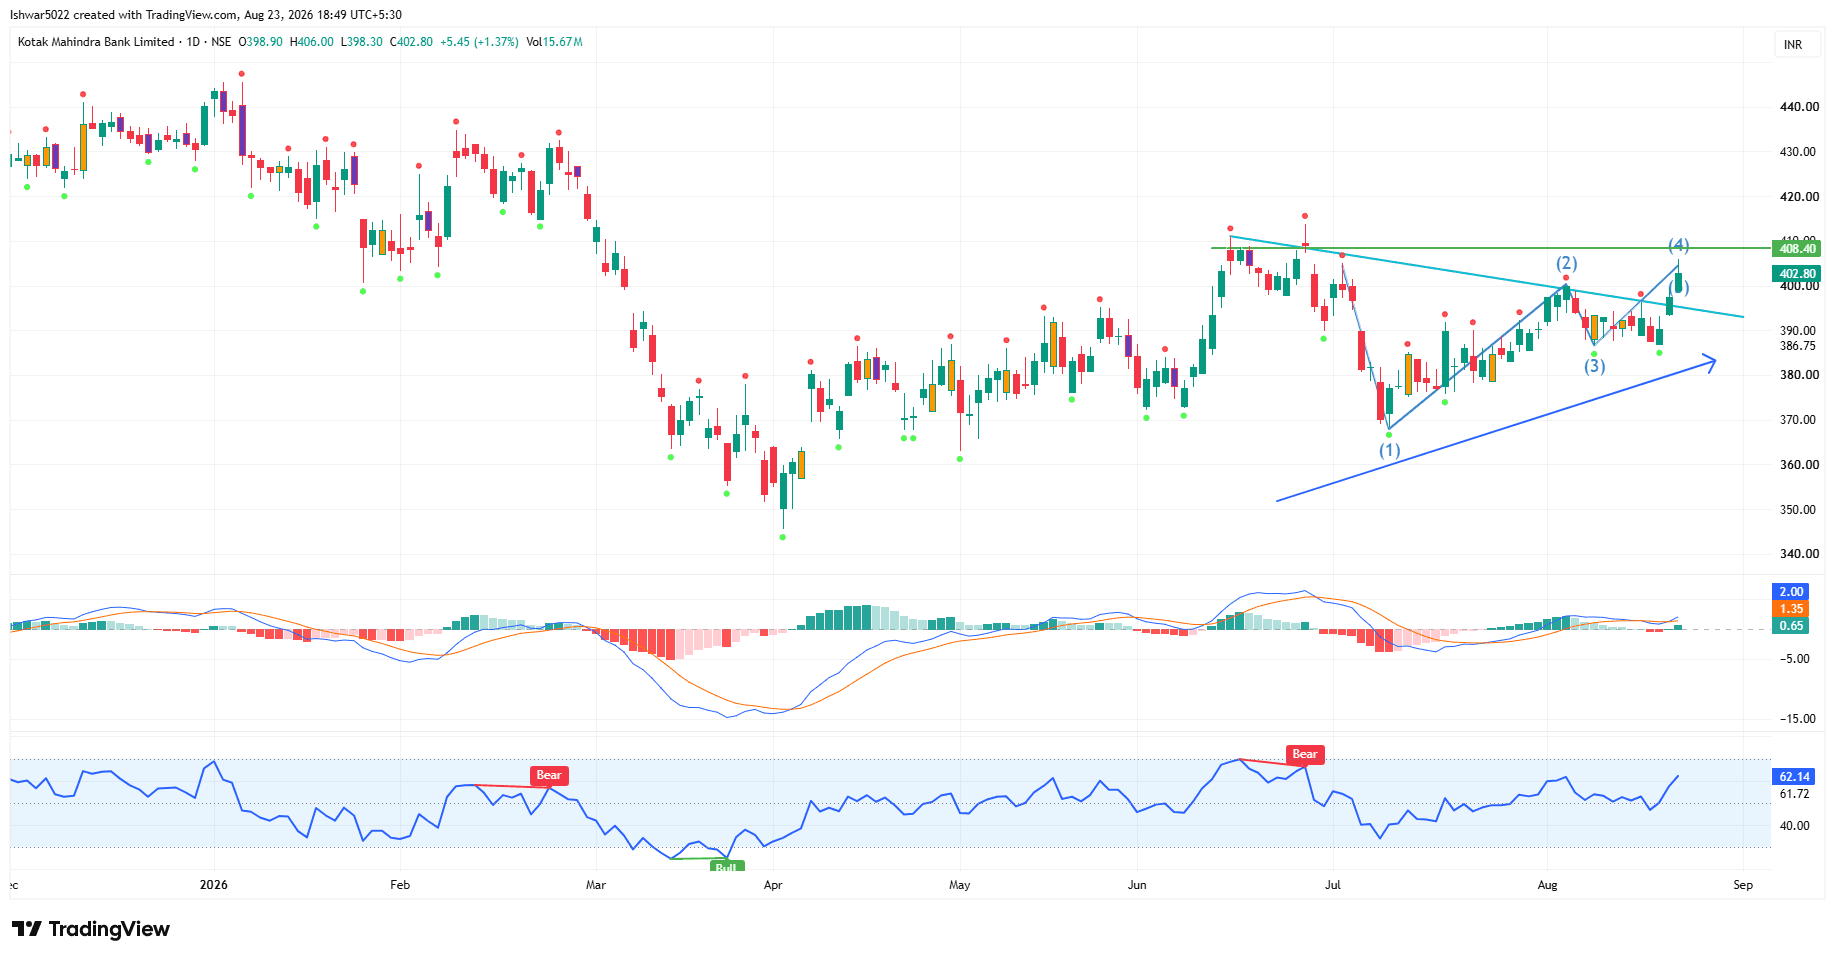
Kotak Mahindra Bank Limited (KOTAKBANK) breakout 409
Technical AnalysisThe chart showcases a classic bullish structural setup following a significant correction earlier in the ***** Structure & Waves: The chart identifies a developing structural sequence marked by labels (1), (2), (3), and (4). This looks like a healthy impulse recovery or an Elliott Wave framework breakout ***** & Resistance:Resistance: There is a clear overhead horizontal resistance line plotted right at ₹408.40, which aligns with previous peaks. The asset is testing this ***** Line: A strong, ascending blue trendline serves as dynamic support. It successfully caught the bottom of wave (3) and keeps the current short-term uptrend structurally ***** (Moving Average Convergence Divergence): The MACD histogram in the middle pane shows positive, shifting momentum. The MACD line (blue) has crossed or is tracking tightly above the signal line (orange), supporting a bullish bias as long as it holds above ***** (Relative Strength Index): Positioned in the bottom pane at 62.14. It is in a healthy momentum zone—above the neutral 50 line but well below the overbought threshold (70). This suggests room for a potential breakout above the ₹408 resistance before exhaustion sets in. Fundamental ContextKotak Mahindra Bank is one of India's premier private-sector banking ***** setups like this structural base breakout typically mirror improving underlying fundamentals, such as steady net interest margins (NIMs), controlled non-performing assets (NPAs), and reliable credit growth.A decisive breakout over the technical resistance at ₹408.40 would signal strong market validation of the bank's forward earnings ***** you like to analyze specific stop-loss targets or look closer at the MACD crossover history for this stock?