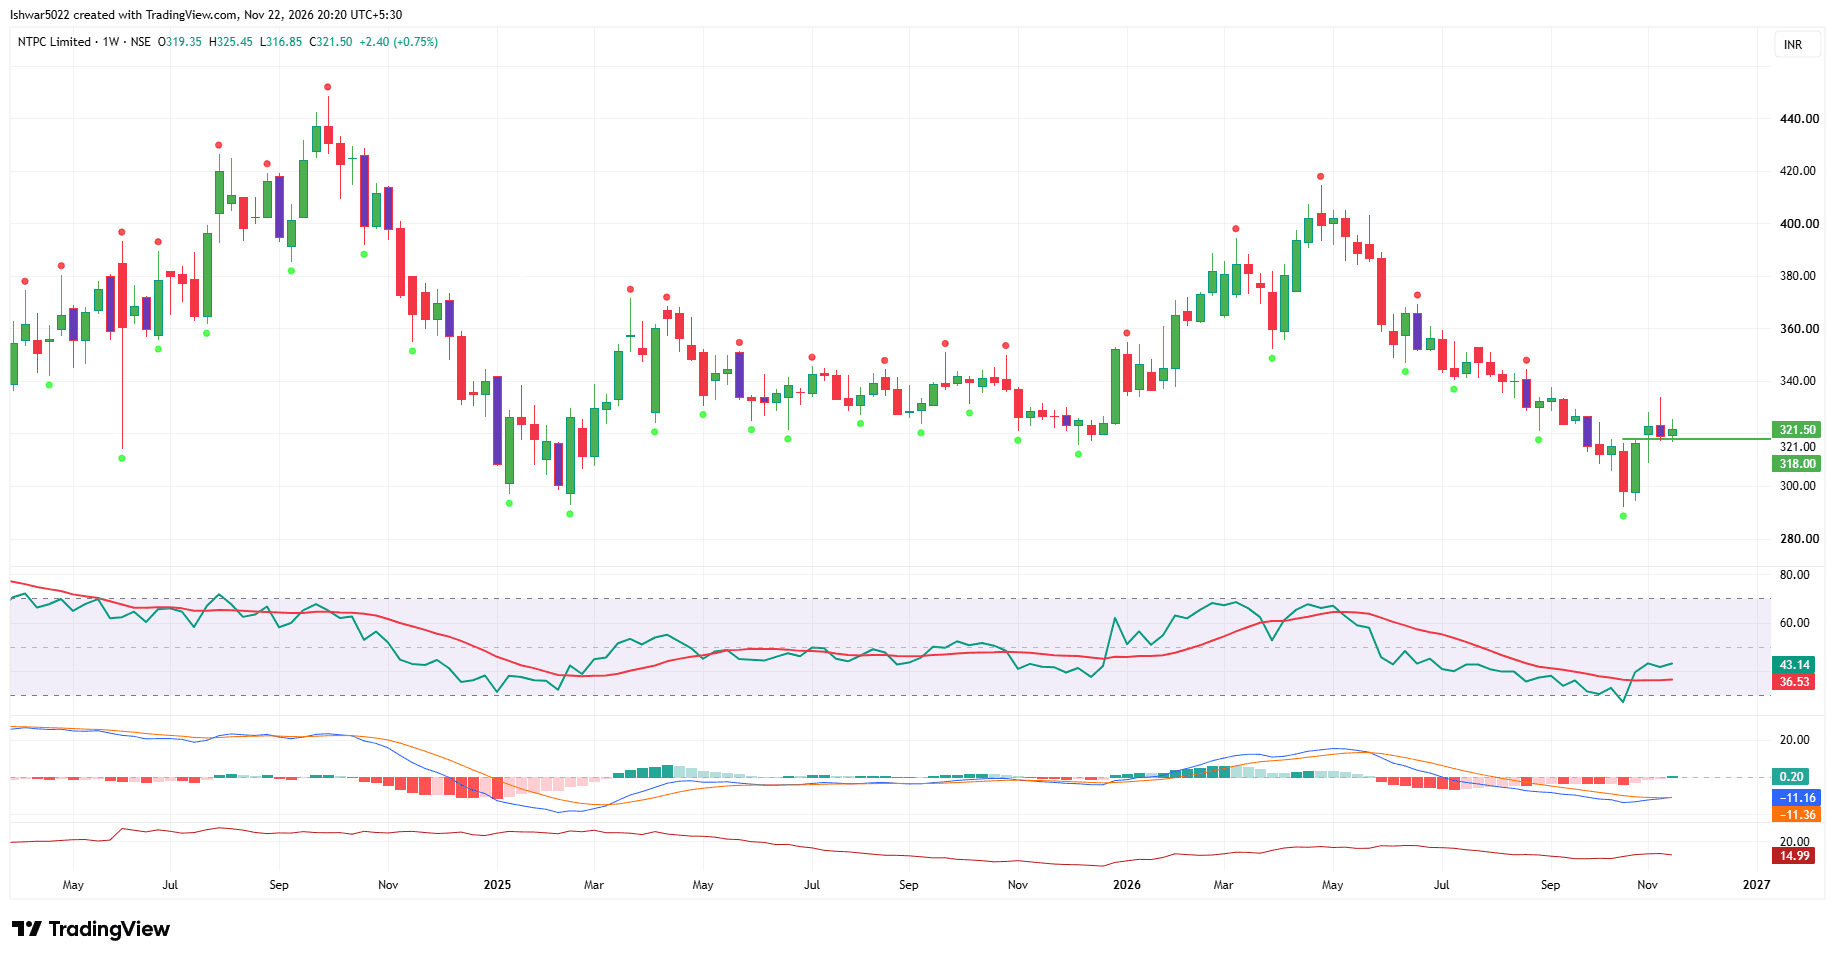
NTPC Rebounds From Multi-Year Support With Bullish Crossover
Technical Analysis On the weekly chart, NTPC Ltd (NSE: NTPC) closed at ₹321.50 (+0.75%), staging a base reversal after defending key multi-year horizontal support around ₹290–₹300. The stock is consolidating cleanly above the ₹318–₹321 pivot zone. Weekly RSI has turned upward to 43.14 (crossing above its signal line at 36.53) after recovering from near-oversold levels, signaling renewed buying strength. Meanwhile, the MACD has generated a fresh bullish crossover (-11.16 vs. signal -11.36) with positive histogram ticks (0.20), confirming early trend reversal momentum. Fundamental Analysis As India’s largest power utility (~25% of national generation capacity), NTPC offers predictable earnings backed by regulated cost-plus ROE models on thermal assets and aggressive renewable energy expansion via NTPC Green Energy. Steady peak power demand growth, healthy operating cash flows, and consistent dividend payouts (~2.5%–3% yield) anchor attractive valuations near ₹***** to BuyStrong Base Reversal: Hammer-like recovery off ₹290 support followed by stability above ₹320. Momentum Inflection: Simultaneous weekly RSI and MACD bullish crossovers. Green & Thermal Visibility: Regulated thermal cash flows funding high-growth solar/wind capacity ***** Setup (Positional)Entry: ₹318.00 – ₹325.00 Stop Loss (SL): ₹294.00 (below the recent weekly swing low) Target 1: ₹360.00 Target 2: ₹400.00 Disclaimer: Educational analysis only, not SEBI-registered investment advice.