


TVSMOTOR
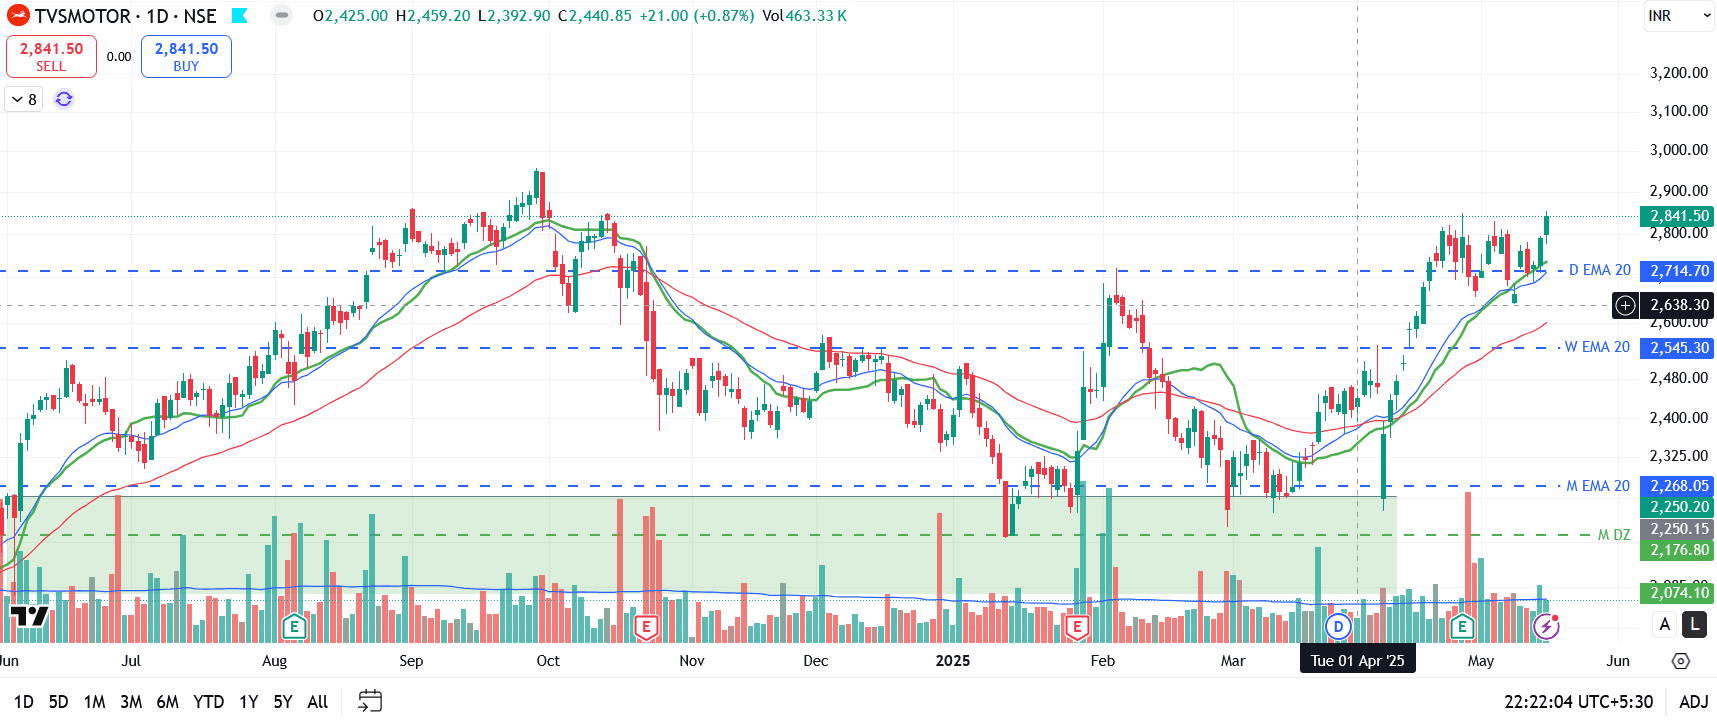
TVSMOTOR On the daily chart, TVS Motor has confirmed a "Flag" continuation pattern breakout at Rs 2,810 on a closing basis, supported by huge volumes. The stock is well-positioned above its 20-day, 50-day, 100-day, and 200-day SMAs, and these averages are also rising along with prices, reaffirming bullish sentiments. The weekly Bollinger Bands buy signal suggests increasing momentum. The daily and weekly RSI strength indicators indicate that buying may occur at current levels. Investors should consider buying, holding, and accumulating this stock.
#TechnicalViews#EquityResearch#HiddenGems#WatchOutFor#StockInNews
157 likes·68 comments