1 hour ago · SEBI Registration INH000027937
SEBI Registration INH000027937 · 1 hour ago
Has Pidilite Cleared the Way for a ₹1,650 Retest?
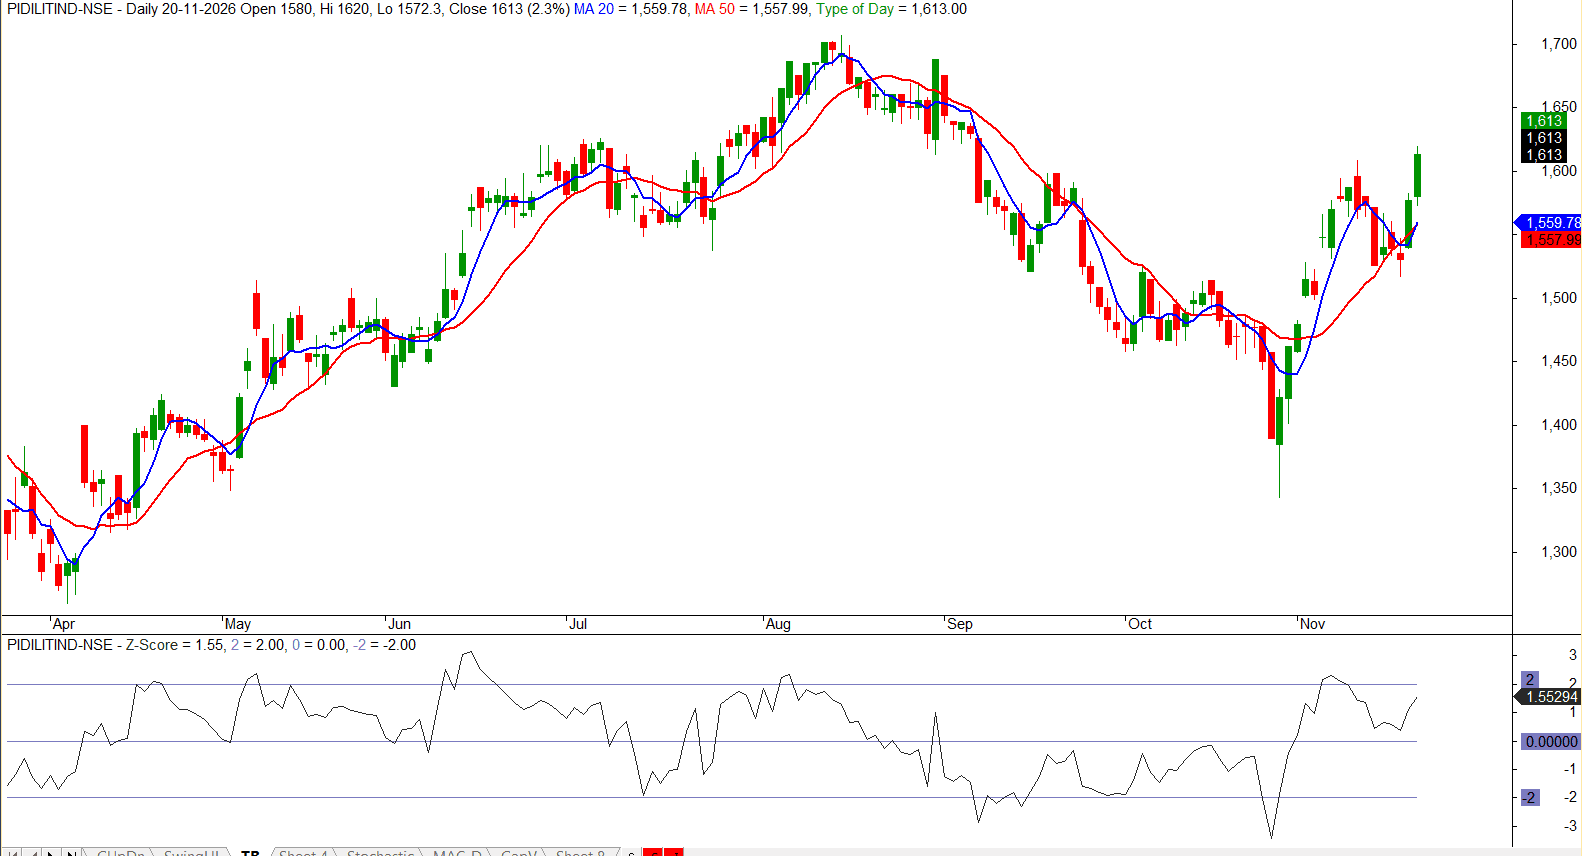
THE BREAKOUT PIDILITIND Pidilite’s chart dated 20 November shows a 2.3% advance to ₹1,613, with the candle closing near its ₹1,620 high. The move has cleared the early-November swing area around ₹1,590–1,600 after a pullback formed a higher low near ₹1,520–1,540. WHAT SUPPORTS THE MOVE? The 20-day and 50-day averages are closely aligned around ₹1,558–1,560, with price now above both. This creates a useful support reference beneath the breakout. The supplied chart displays Z-score rather than Fisher Transform. Its reading of 1.55 has turned higher following the recent cooling phase, supporting renewed positive momentum while remaining below the +2 threshold. THE FOLLOW-THROUGH TEST Holding ₹1,590–1,600 on a retest would suggest that former resistance is becoming support. A sustained move above ₹1,620 would strengthen the case for a test of the earlier ₹1,650 supply region, followed by the August peak around ₹1,700. WHEN TO REASSESS A close back below ₹1,590 would question the breakout’s strength. Losing the moving-average cluster near ₹1,558 would weaken the recovery further and shift attention toward ₹1,520–1,540. The next useful evidence is whether buyers defend the breakout area after this strong candle.