‹ All Posts
Lovelesh Sharma

18 mins ago · SEBI Registration INH000027937

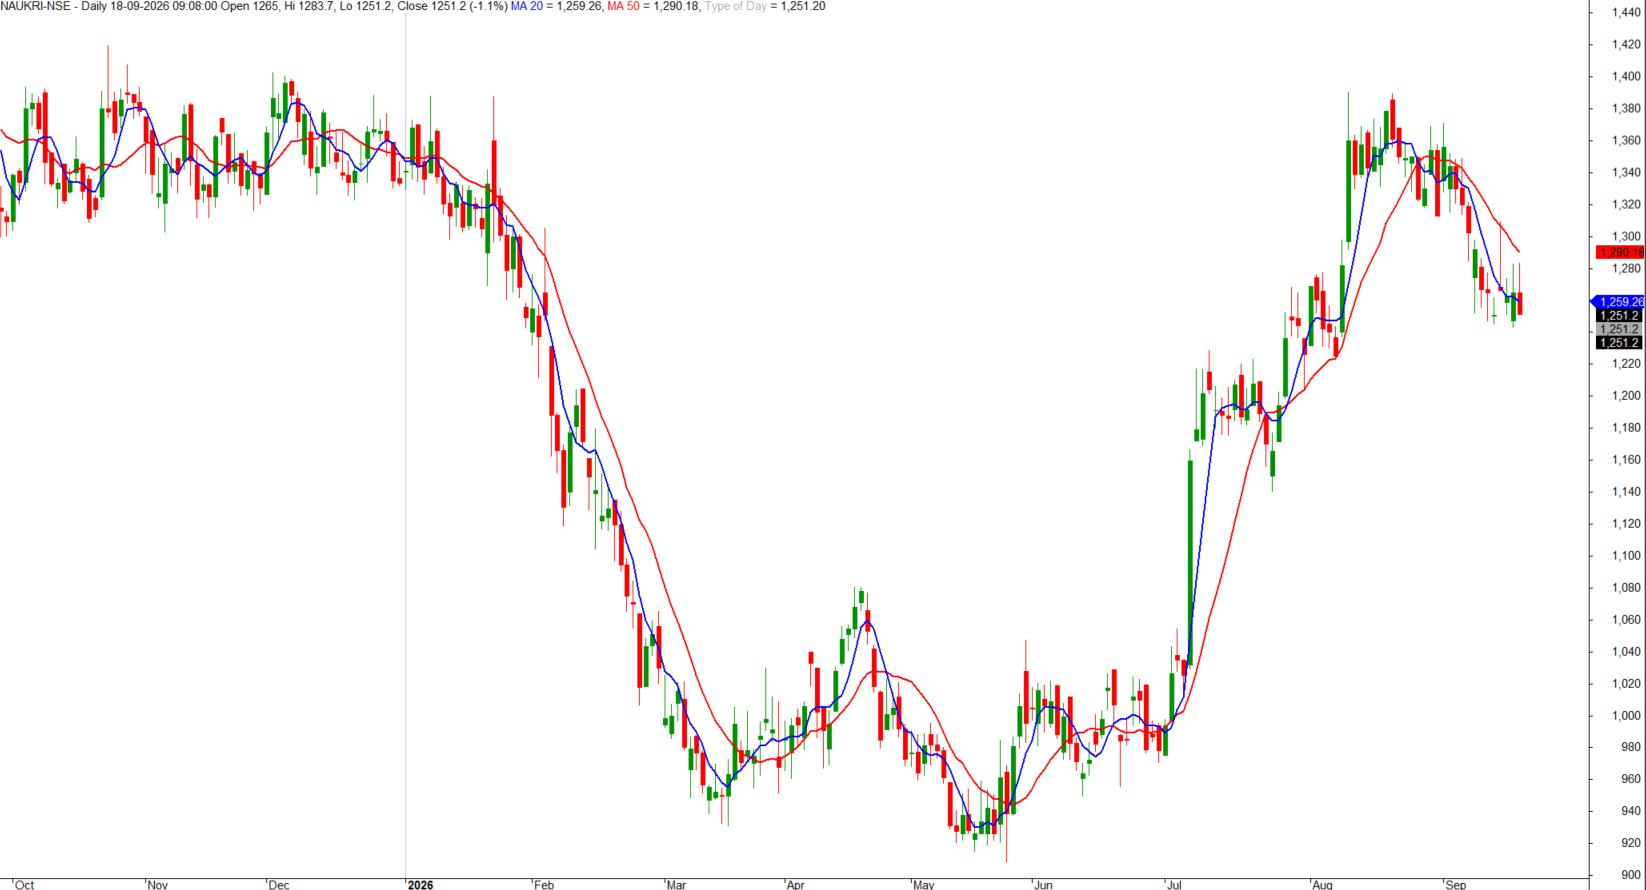
Info Edge slips below its 20 and 50 day averages
NAUKRI
closed at Rs 1,251.2 on September 18, down 1.1 percent for the session. That puts the stock below both its 20 day average of 1,259.26 and its 50 day average of 1,290.18. Naukri gave up 1.1 percent to close at 1,251.2, after opening at 1,265 and touching a high of 1,283.7. This close is under the 20 day average (1,259.26) and further under the 50 day average (1,290.18). The stock had run up strongly from around 950 in May to a high near 1,390 in August, so this is the first real dip below both averages since that rally started. Momentum names that run up fast tend to cool off by either consolidating sideways or slipping under the shorter average first. Right now Naukri is doing exactly that, the 20 day average is sitting close to the 50 day average, and a close under both suggests buyers who chased the August high are sitting on short-term losses. That usually brings some hesitation before fresh buying steps back in. When I look at this chart, the pullback from 1,390 to 1,251 is roughly 10 percent, which is a normal give-back after a move that size, not a breakdown. What would worry me more is if the 20 day average actually crosses below the 50 day average and price keeps closing under both. That has not happened yet, the averages are still close together. So I am reading this as a pause inside an uptrend for now, not a trend reversal.

#EquityResearch#TrendingSectors#HiddenGems
Screenshot 2026-09-18 161333.png
3 likes·3 comments