‹ All Posts
Lovelesh Sharma

28th Sep · SEBI Registration INH000027937

Neuland Laboratories: Strong Prior Trend, Deeper Correction
NEULANDLAB
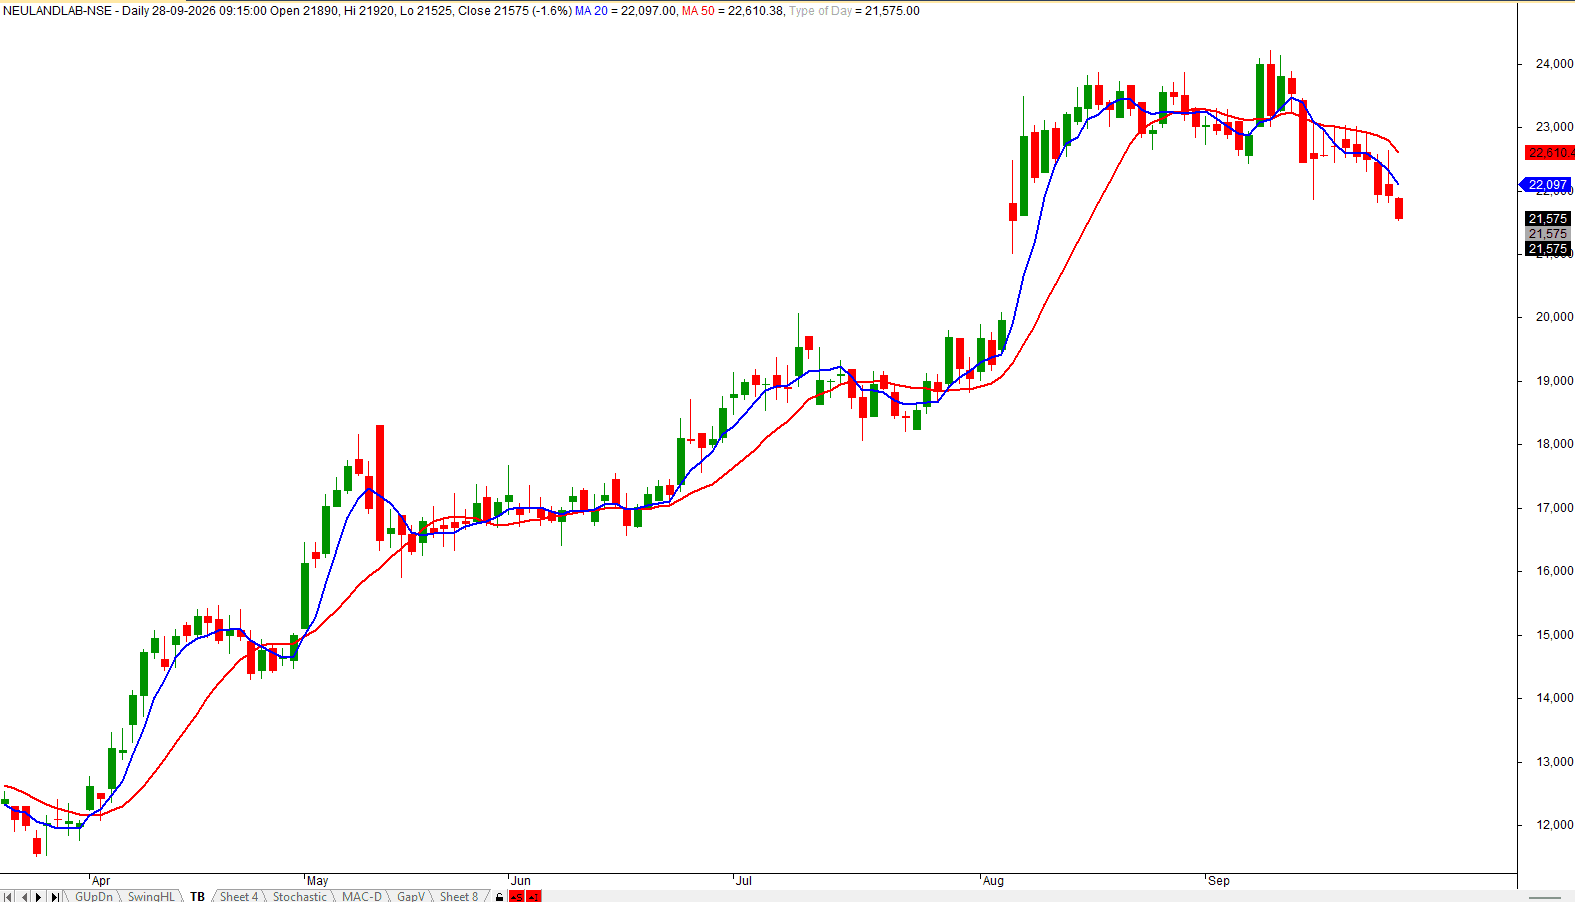
stock had a strong advance from roughly ₹12,000 in March to above ₹24,000 in early September, but the latest price action shows that the rally has shifted into a corrective phase. The moving averages now confirm that change in momentum. Price is below the 20-day moving average at ₹22,097 and below the 50-day moving average at ₹22,610. The 20-day average has turned lower and is moving away from the 50-day average, showing that the recent selling pressure is not limited to a single weak session. ₹22,097 is the first recovery level to watch. A move above it would indicate that price is attempting to regain short-term momentum. However, the more important resistance is ₹22,610, where the 50-day moving average sits. A sustained close above ₹22,610 would suggest that the correction is stabilising and could bring ₹23,000–₹23,500 back into focus. On the downside, ₹21,500 is the immediate support zone. A close below it could expose ₹21,000, followed by the August breakout area near ₹20,000. That zone is important because it was the base before the sharp August rally. Holding above ₹21,500 would keep the current move in the category of a controlled correction; losing it would raise the possibility of a deeper retracement. Neuland’s pharmaceutical API and CRAMS exposure provides a long-term business theme, but the chart currently calls for caution. The larger uptrend is not broken yet, though price needs to reclaim the 20-day and 50-day averages before the next upward leg can be considered confirmed.

#WatchOutFor#Today’sTradingSetup#StockInNews
Screenshot 2026-09-28 115456.png
678 likes·31 comments