


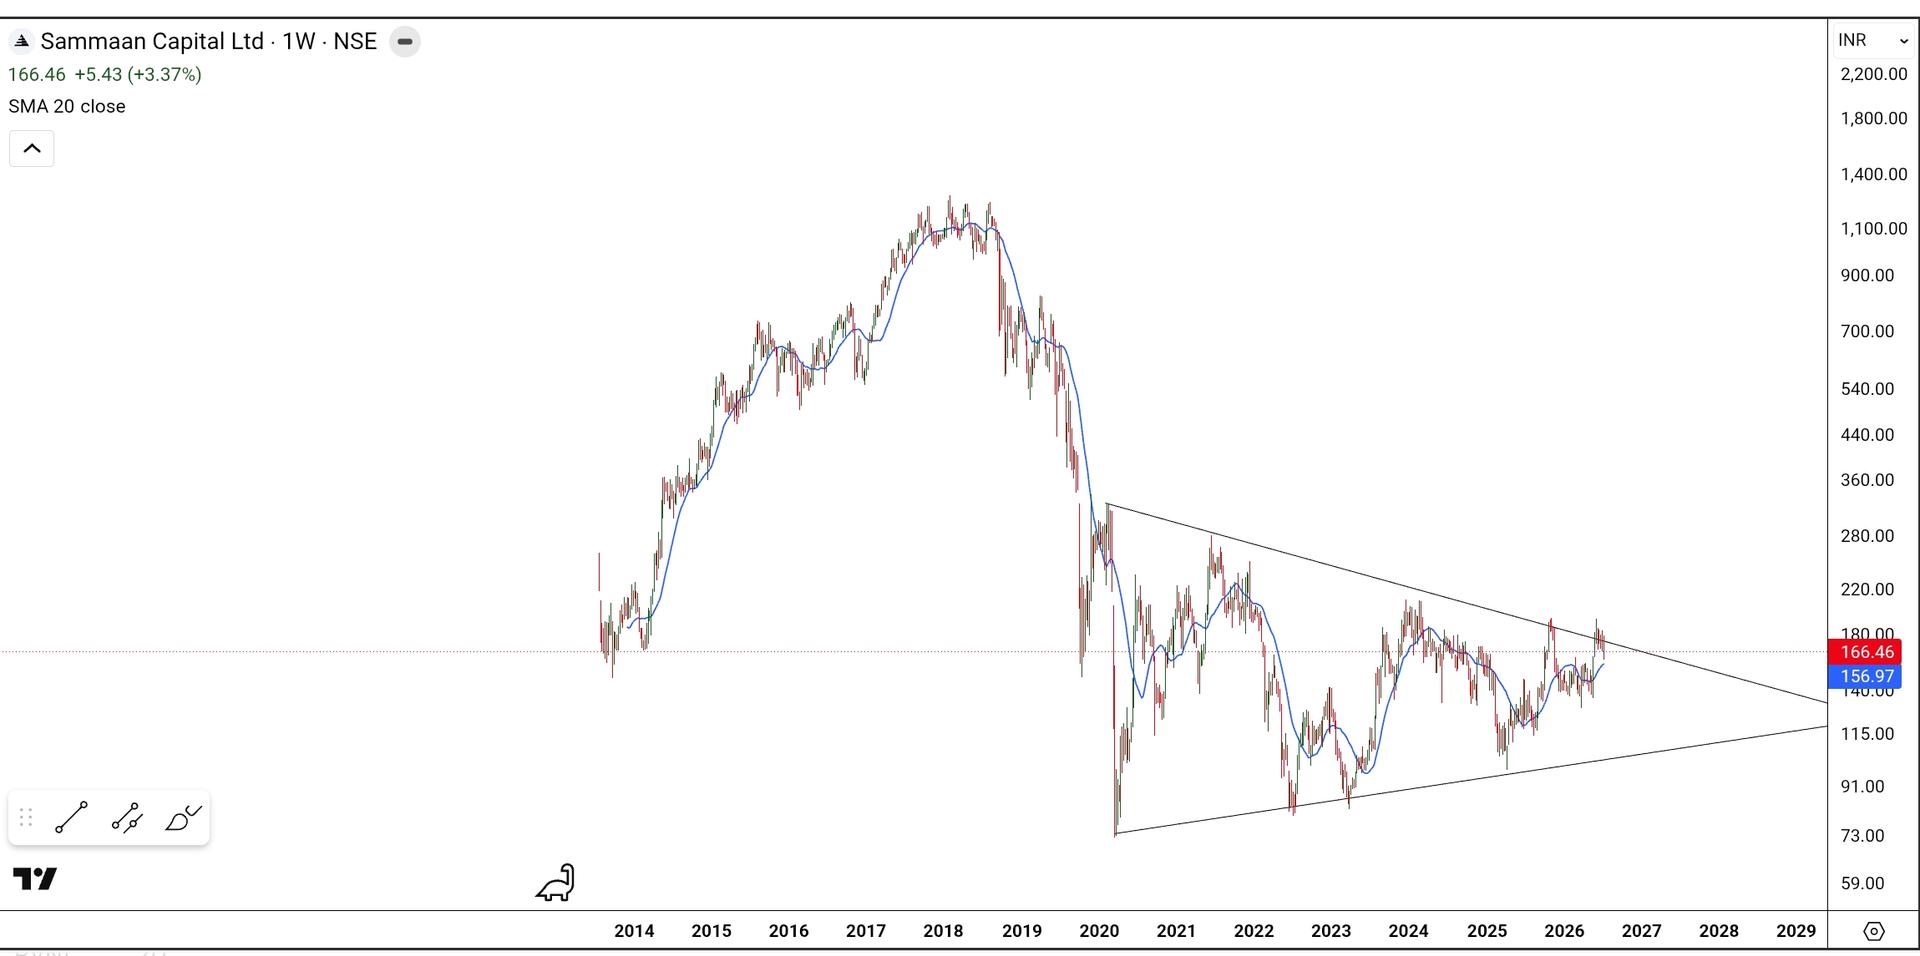
SAMMAANCAP triangle change of trend ?
SAMMAANCAP the stock is forming a triangle pattern for a long time now, over a couple of years, after a bearish trend. The overall range seems to be from 240 on the upper side to the much lower side but now it has reduced to 295 to 115. Only a break above 195 and sustaining that level can push Samman capital towards a higher level and we may see a beginning of a rebound in the stock. Otherwise a mild weakness can further push the stock to much lower levels of 160, 140, and then 120.
#StockInNews#Today’sTradingSetup#WatchOutFor
1,129 likes·42 comments