


9th Jan 2025 · SEBI Registration INH000015604
SEBI Registration INH000015604 · 9th Jan 2025
TCS
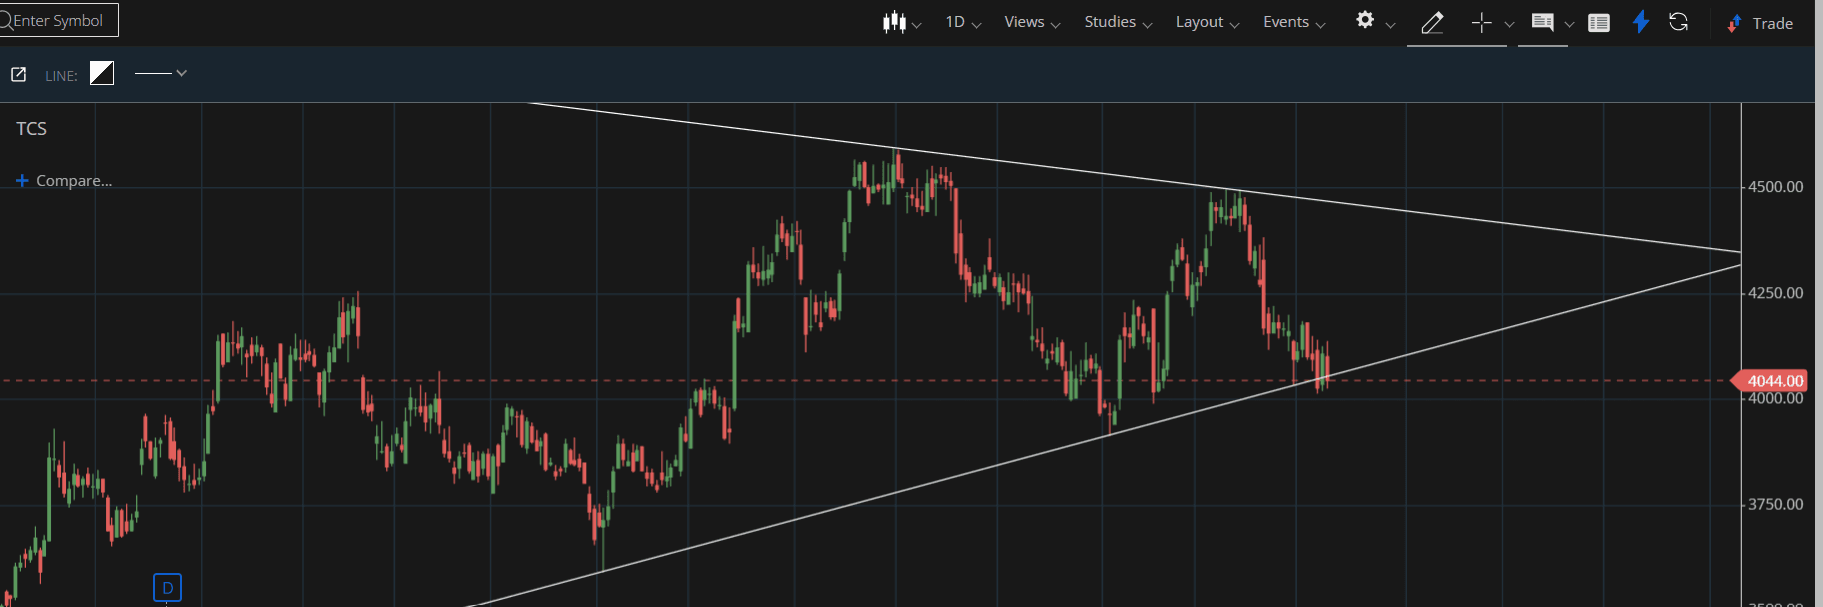
TCS EOD CHART 📈 ANALYSIS: The price is forming a triangle pattern, indicating potential downside movement below the level of 4000.
#TechnicalViews#EquityResearch
272 likes·66 comments