Fair Value Gap: The Hidden Imbalance on a Price Chart
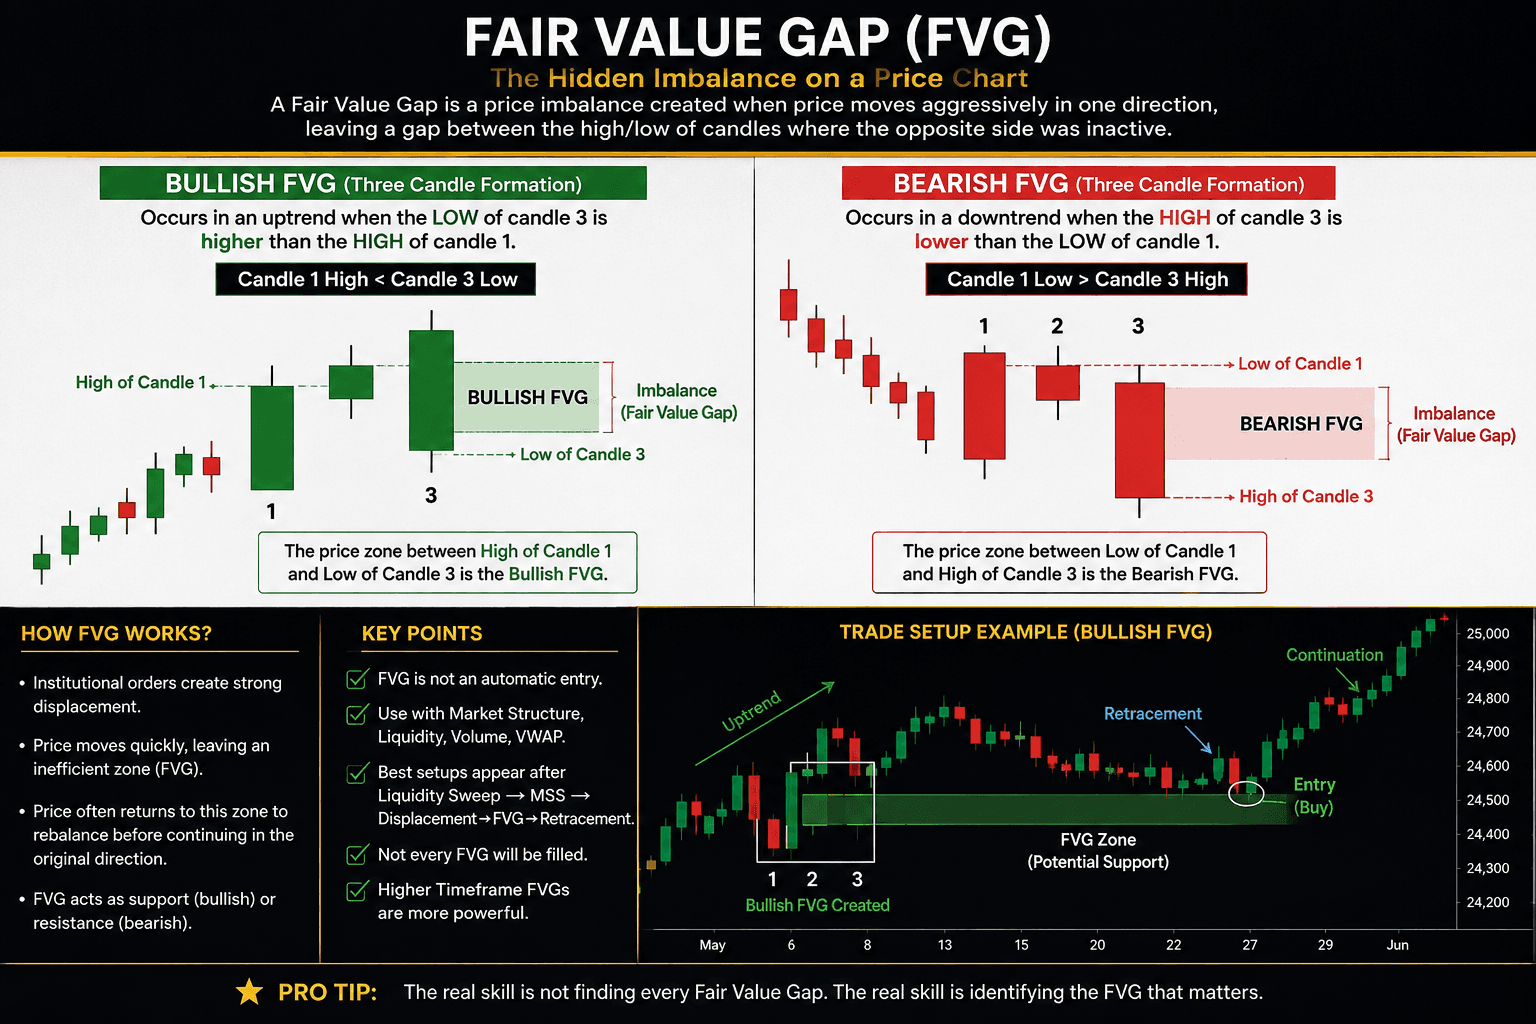
A Fair Value Gap (FVG) is one of the most useful concepts for traders who study price action, market structure and Smart Money Concepts. It represents an area on the chart where price moved so aggressively that a temporary imbalance between buyers and sellers was created. What Is a Fair Value Gap? A classic bullish FVG appears across three candles when the low of the third candle is higher than the high of the first candle. In simple terms: Candle 1 High < Candle 3 Low The price zone between these two levels becomes the bullish Fair Value Gap. A bearish FVG is the opposite: Candle 1 Low > Candle 3 High This creates an imbalance where sellers moved price aggressively downward. Why Does an FVG Matter? Markets do not always move in a perfectly balanced manner. During strong institutional buying or selling, price can move rapidly through certain levels without spending much time there. Later, price may return toward that inefficient area. Traders therefore watch FVGs as potential zones for: • Pullback entries • Continuation trades • Support/resistance • Stop-loss placement • Understanding institutional momentum How to Trade a Bullish FVG If price enters the zone and shows: • Buying rejection • Bullish candlestick formation • VWAP support • Higher-low formation • Strong volume the FVG can become a potential continuation entry zone. How to Trade a Bearish FVG In a bearish market, suppose NIFTY creates a bearish FVG between 24,600 and 24,650. If price later rallies into this zone and sellers appear, the area can act as a potential resistance zone. However, an FVG should never be treated as an automatic trade signal. The Professional Approach The strongest FVG setups usually appear after: Liquidity Sweep → Market Structure Shift → Displacement → FVG → Retracement This sequence is much more powerful than simply marking every three-candle imbalance on the chart.