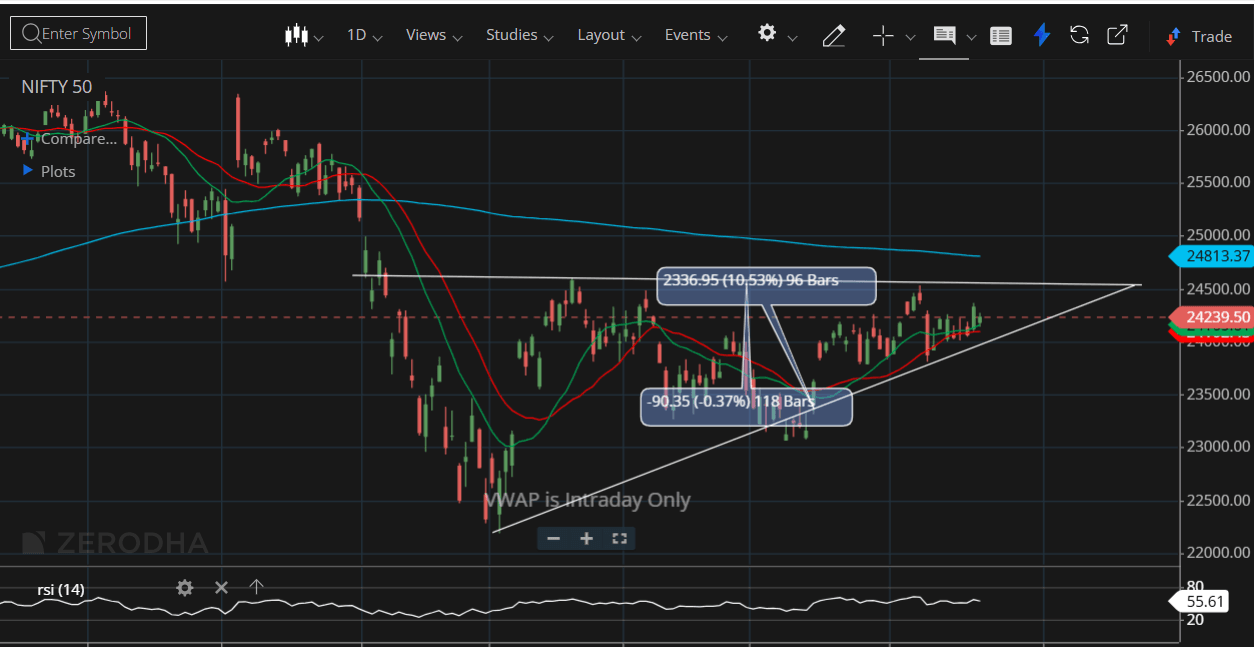
NIFTY 50 – Technical Outlook
NIFTY has recovered strongly from its June low near 22,300 and is now trading near an important resistance zone of 24,500–24,600. This level has stopped the index from moving higher several times, making it the key hurdle for the next major move. On the daily chart, NIFTY is forming an Ascending Triangle, which is generally considered a bullish pattern. It shows that buyers are becoming more confident, as they are buying every dip at higher levels, while sellers continue to defend the same resistance area. This indicates that buying pressure is gradually increasing. The overall trend remains positive as the index is forming a series of higher highs and higher lows, which is a sign of a healthy uptrend. The rising trendline from the June bottom is still intact, showing that buyers continue to support the market during corrections. The important support zone is placed between 23,800 and 24,000. As long as NIFTY stays above this area, the positive outlook remains unchanged. The RSI is around 56, indicating improving momentum without entering the overbought zone. This suggests that the market still has room to move higher if buying continues. Overall, the market structure remains positive, but confirmation above 24,600 is still needed before expecting a strong rally. Until then, NIFTY is likely to trade within the 23,800–24,600 range, and traders should wait for a clear breakout before taking aggressive directional positions.