A Bullish Hammer is a single-candle reversal pattern
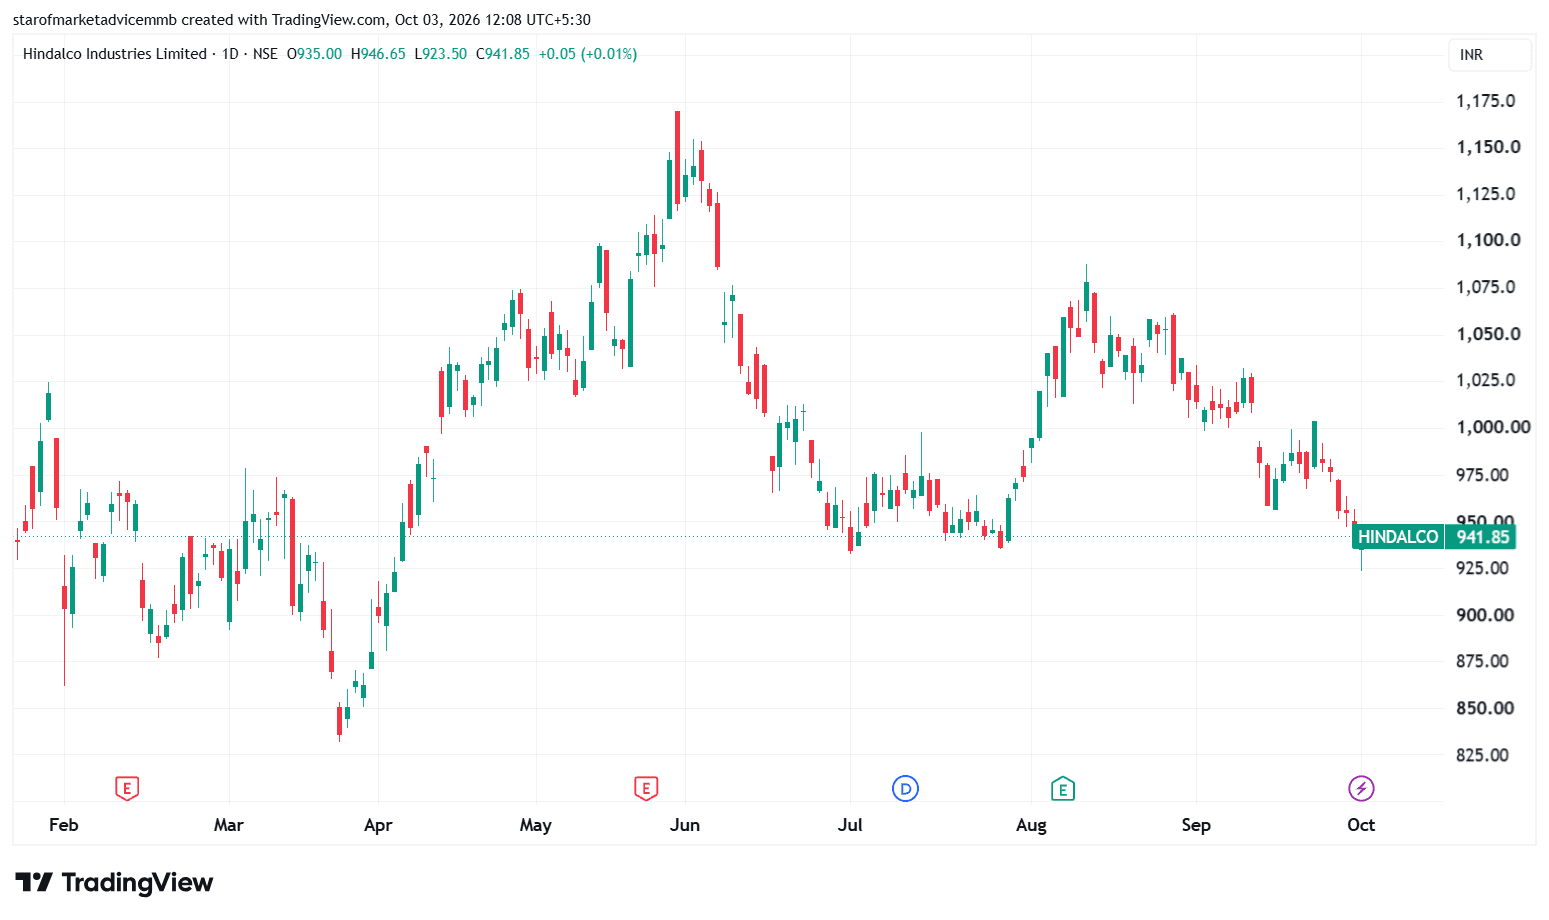
HINDALCO
A Bullish Hammer is a single-candle reversal pattern that generally appears after a decline and indicates that sellers pushed the price sharply lower during the session, but buyers came back strongly and pushed the price near the opening level.
🔨 Structure of a Bullish Hammer
A valid hammer generally has:
Small real body near the upper end of the candle.
Long lower shadow/wick, ideally at least 2 times the size of the body.
Very small or negligible upper wick.
It can be green or red, although a green hammer often shows stronger buying pressure.
Most importantly, it should appear after a downtrend or near a support zone.
Simple structure:
┌───┐
│ │ ← Small body
└───┘
│
│
│
│ ← Long lower wick
│
What actually happens inside the candle?
Suppose a stock opens at ₹500.
During the session, heavy selling takes the price down to ₹470. This initially suggests that sellers are in control.
But near ₹470, buyers enter aggressively. The price recovers and closes around ₹498.
So although sellers managed to push the price ₹30 lower, they could not sustain those lower prices. Buyers absorbed the selling and brought the price back near the opening level.
That is the real meaning of the hammer:
“Lower prices were rejected by the market.”
Why location is extremely important
A hammer does not automatically mean a bullish reversal.
For example:
Hammer in the middle of a sideways market → relatively weak signal.
Hammer after a strong fall + at major support → much more meaningful.
The strongest setup is when the hammer forms around a combination of:
Previous swing low
Horizontal support
Trendline support
Moving average support
Fibonacci support
Demand zone
Previous breakout zone
Example
Suppose Nifty falls from 25,000 → 24,600 and reaches an important support zone around 24,550–24,600.