15th Aug 2025 · SEBI-Registered Analyst
STAROFMARKET ADVICE with MAYANK (SEBI RA) · 15th Aug 2025
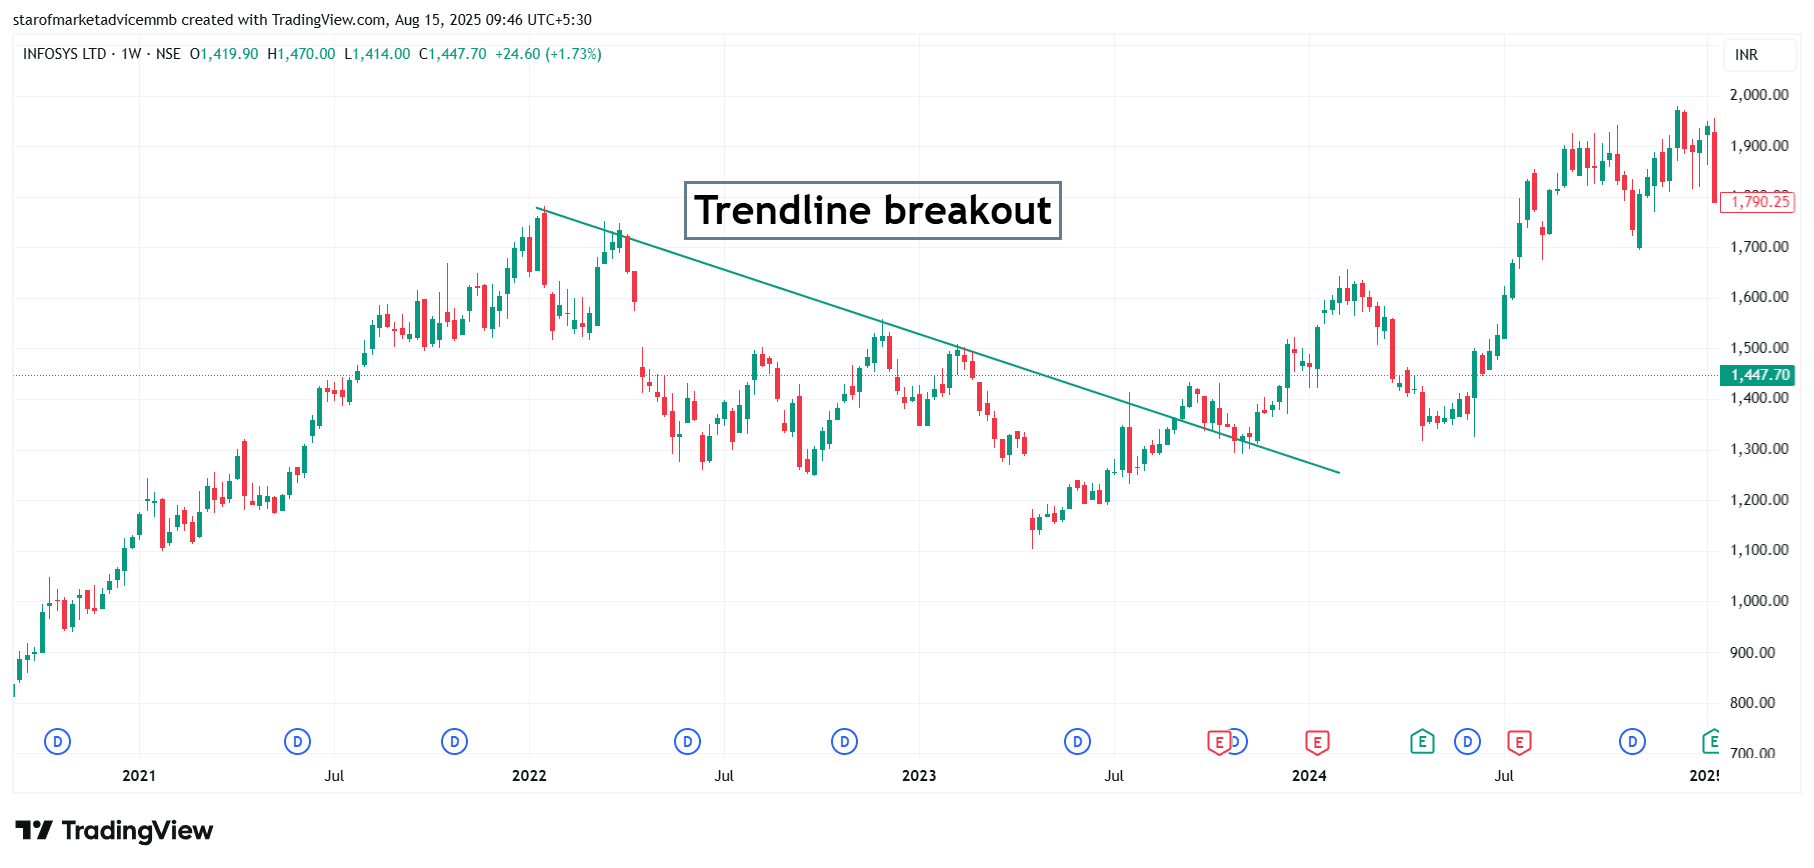
A trendline breakout occurs when the price of a stock breaks through a trendline that has historically acted as a level of support or resistance. In a downtrend, the trendline is drawn by connecting the lower highs, and when price breaks above this line, it signals a potential reversal to an uptrend. In the weekly chart of Infosys Ltd., a downward sloping trendline had been acting as resistance for several months. The breakout above this line indicated a shift in market sentiment from bearish to bullish, often attracting buyers and leading to a strong upward rally. This breakout is a classic technical signal that trend momentum is changing, especially when supported by volume and follow-through candles.