‹ All Posts
Mayank Kumar

17th Sep · SEBI Registration INH000015978

A trendline support is a rising line drawn
NESTLEIND
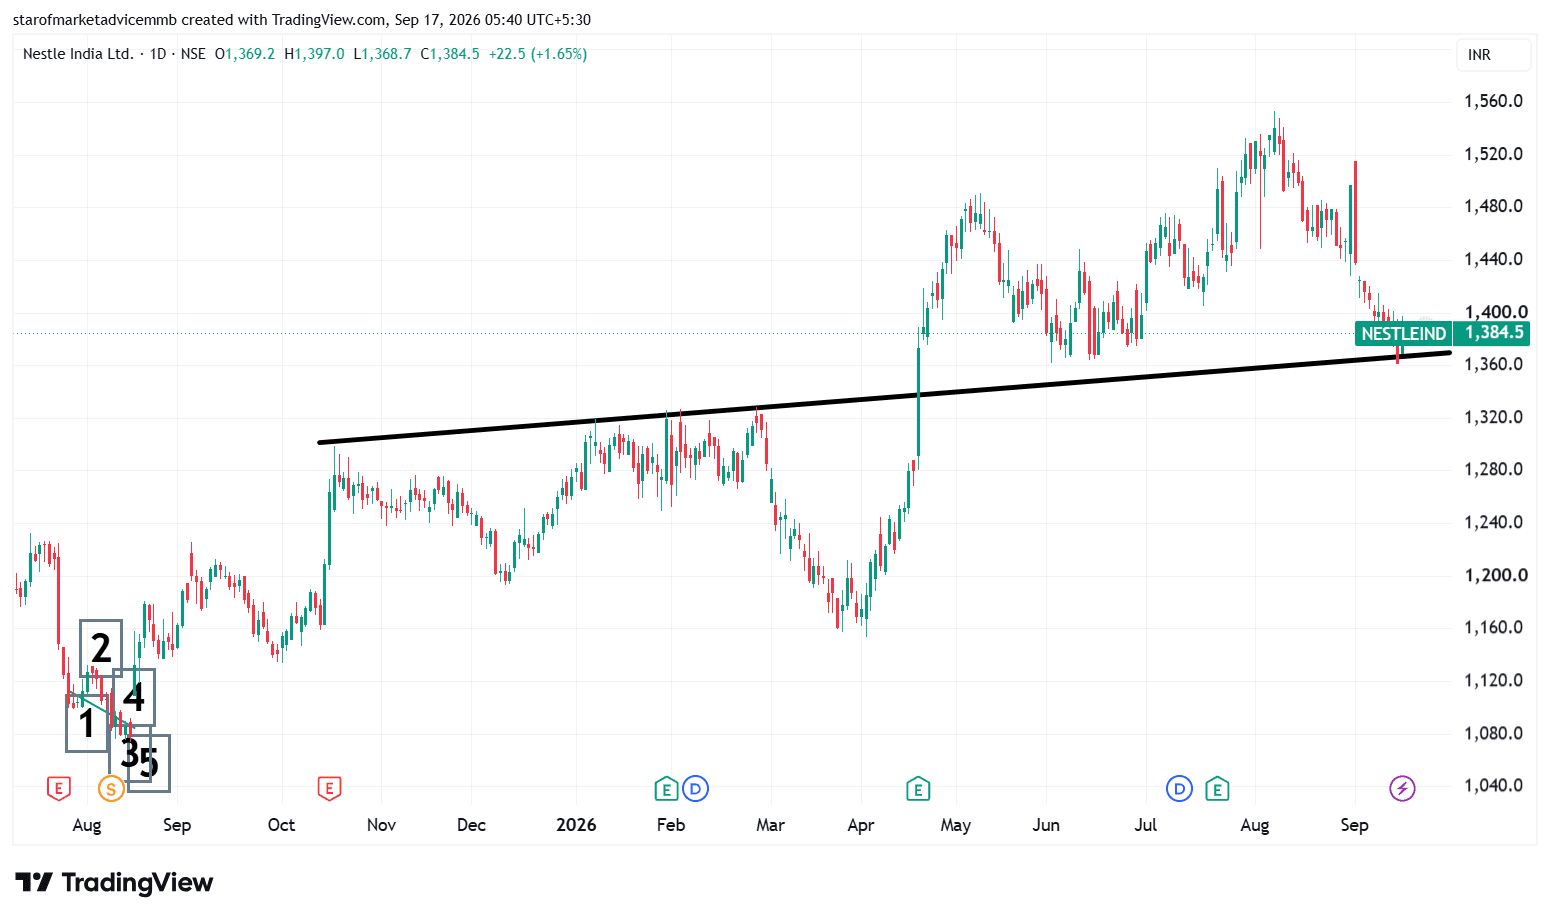
A trendline support is a rising line drawn by connecting important swing lows on a price chart. It represents an area where buyers have previously shown interest as the price moves upward. In this Nestlé India chart, the rising trendline connects multiple important low points, and the current price is approaching the ₹1,350–₹1,370 support zone. The important point is that support is a zone, not an exact price. Price does not necessarily have to touch ₹1,360 and immediately reverse. It can move through ₹1,350–₹1,370 intraday and still recover above the zone. How does a trendline support react? 1. Price approaches the trendline When price falls toward the rising trendline, traders watch whether buying interest appears around that area. 2. Buyers defend the zone If buyers enter, price may form candles with lower wicks, bullish reversal patterns, or increased buying volume. A bounce from the trendline suggests that the support is being respected. 3. Strong bounce = support confirmation If price reaches the zone and subsequently moves back above nearby resistance, the trendline can be considered to have provided support on that occasion. 4. Temporary penetration is possible A price move slightly below the trendline does not automatically mean a breakdown. The important observation is where the candle closes and whether subsequent candles reclaim the zone. 5. Decisive breakdown changes the structure If price closes decisively below the trendline/support zone and continues trading below it, the previous support may lose significance. Traders then generally look for the next horizontal support or swing-low area rather than assuming the trendline will continue to hold.

#TechnicalViews
NESTLEIND_2026-09-17_05-40-21.png
541 likes·60 comments