17th Aug 2025 · SEBI-Registered Analyst
STAROFMARKET ADVICE with MAYANK (SEBI RA) · 17th Aug 2025
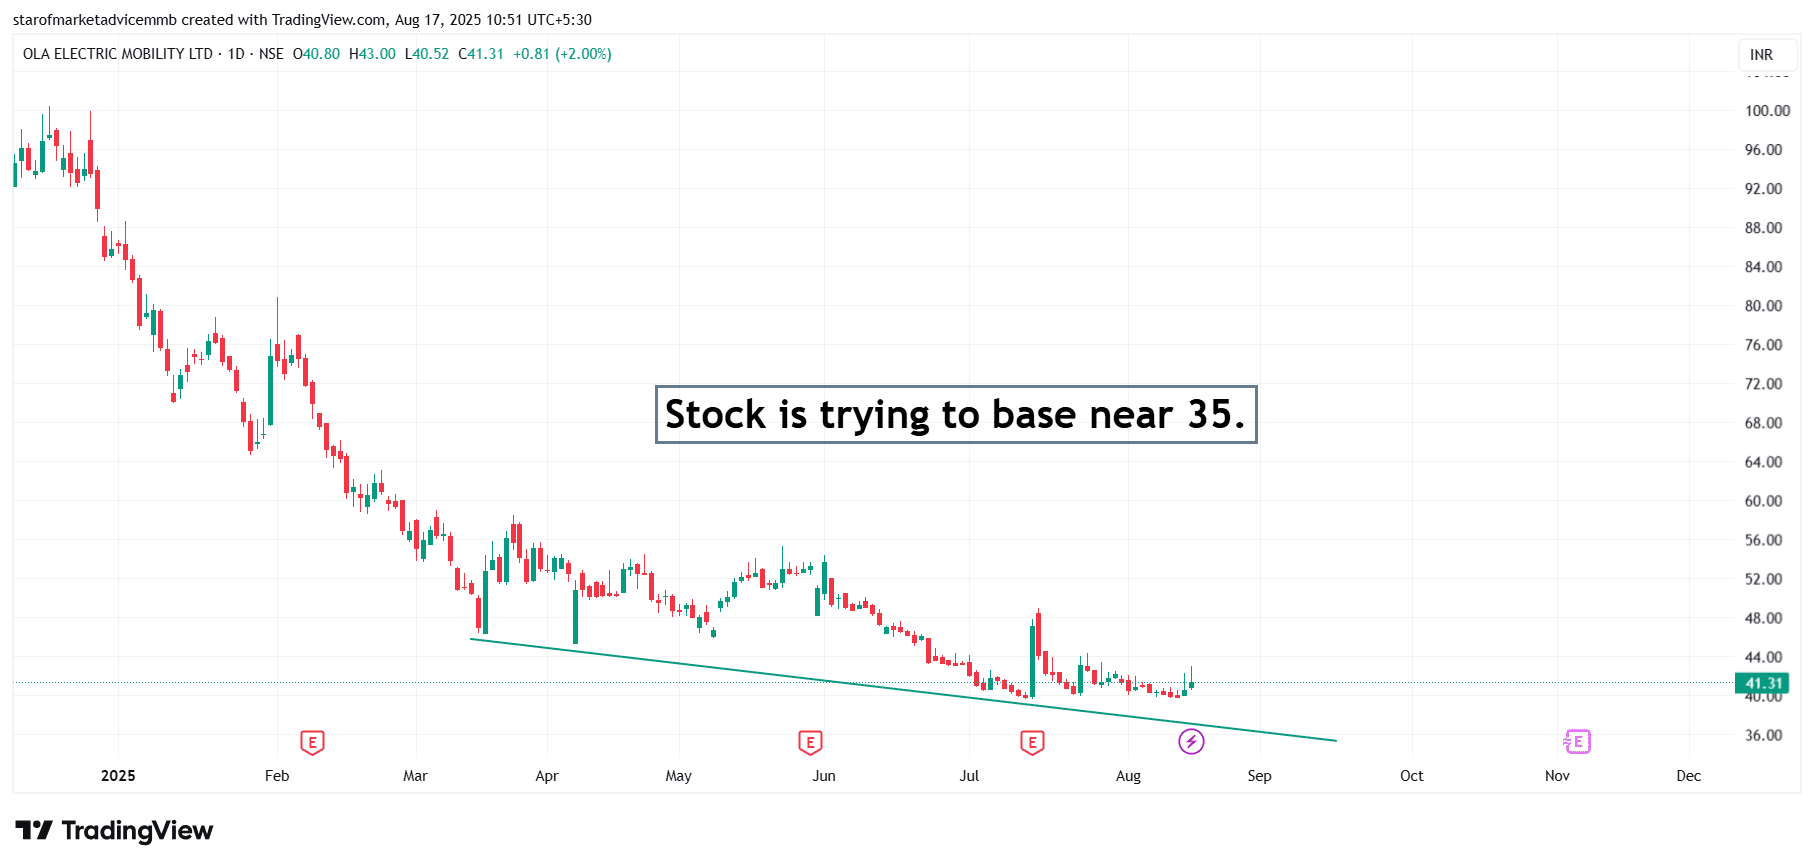
A Trendline Support Zone is an area on a chart where the price consistently finds support along a rising trendline. This trendline is drawn by connecting two or more higher lows on the chart and helps identify a bullish trend.
Key Points:
It represents a rising support line where the price tends to bounce back after touching it.
As long as the price stays above the trendline, the trend is considered strong or bullish.
If the price breaks below the trendline, it can indicate a trend reversal or weakening momentum.
Traders often look for buying opportunities near this support zone, placing stop-losses just below the trendline.
Example:
If a stock bounces from levels like ₹100, ₹120, and ₹140, and you draw a line connecting these lows, that line forms a trendline support zone. The next time price comes near that line, traders expect it to act as support again.