‹ All Posts
Mayank Kumar

18th Jun 2025 · SEBI-Registered Analyst

Fibonacci retracement is a powerful tool used in technical analysis to identify potential support and resistance levels during trend continuation.
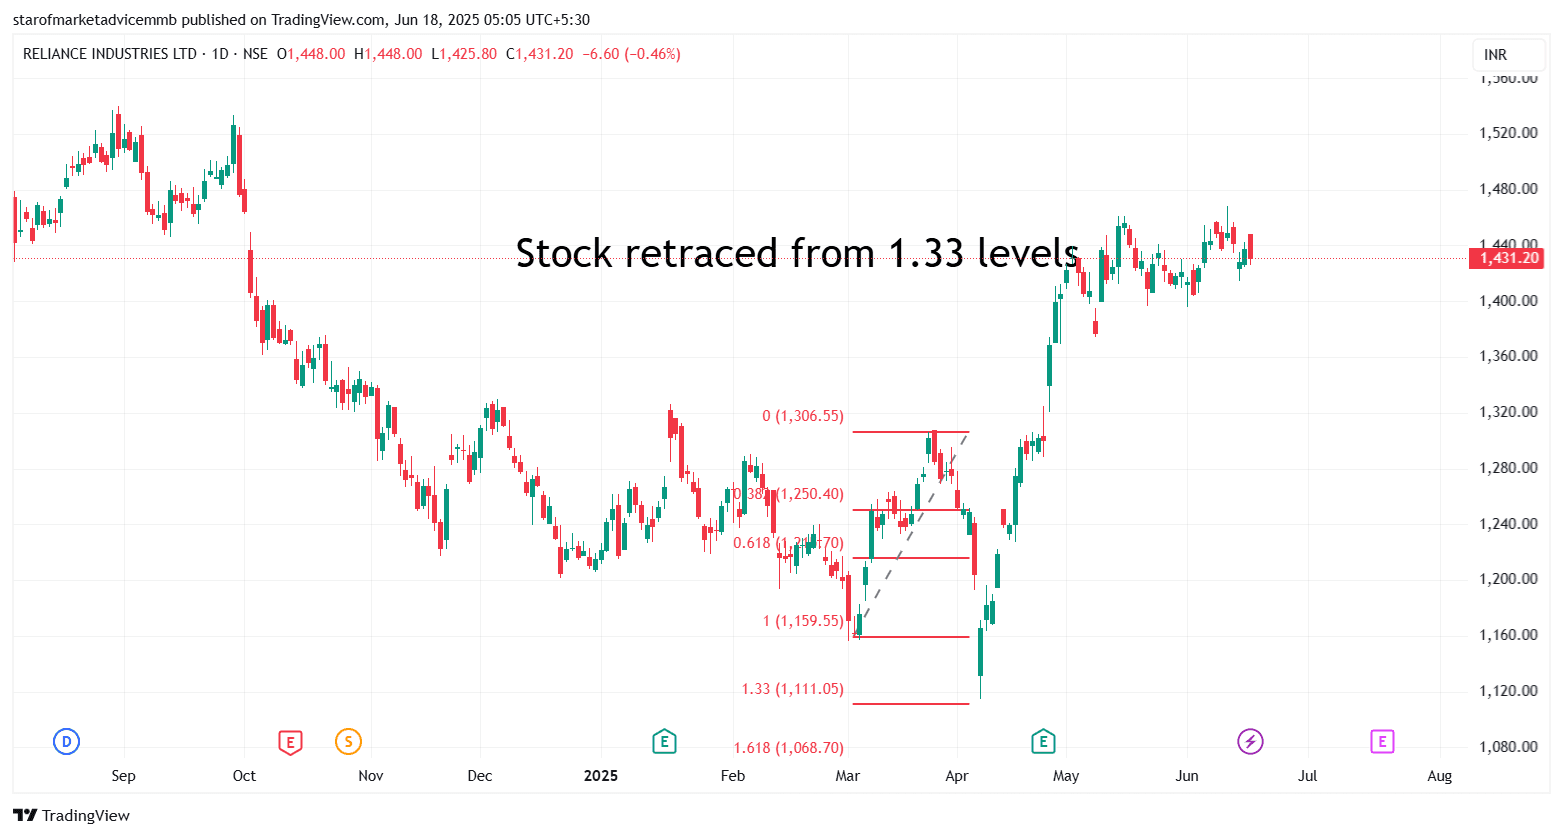
RELIANCE
Fibonacci Retracement in Trend Continuation 🔹 1. Understanding the Setup In an uptrend, the price makes higher highs and higher lows. After a strong impulse move upward, price tends to pull back or correct. This correction is where Fibonacci retracement levels come into play. 🔹 2. How It Works Traders draw Fibonacci retracement from the swing low to swing high in an uptrend (and reverse in a downtrend). The key Fibonacci levels are: 23.6% 38.2% 50% (not official Fibonacci but widely used) 61.8% (Golden Ratio) 78.6% These act as potential support zones where price might stop falling and resume the trend. 🔸 Example in an Uptrend Price rises from ₹100 to ₹150 (impulse leg). Draw retracement from ₹100 (low) to ₹150 (high). Fibonacci levels will show: 38.2% = ₹130.90 50% = ₹125 61.8% = ₹119.10 These are areas where buyers may step in again, expecting the uptrend to continue. 🔹 3. Why It Works Fibonacci levels reflect natural proportions found in nature and human behavior (herd psychology). In markets, many traders look at the same levels—so they often act as self-fulfilling prophecies. 🔹 4. Entry Strategy Using Retracement Wait for price to pull back to a key Fibonacci level. Confirm with other tools (like candlestick patterns, RSI, or moving averages). Enter trade in the direction of the trend when price shows signs of reversal from that level. 🔹 5. Caution Not every retracement respects Fibonacci levels. Always combine it with volume, trendlines, or indicators for confirmation.

#TechnicalViews#FundamentalViews
RELIANCE_2025-06-18_05-05-26.png
205 likes·63 comments