STAROFMARKET ADVICE with MAYANK (SEBI RA) · 15th Apr 2025
Grasim
GRASIM
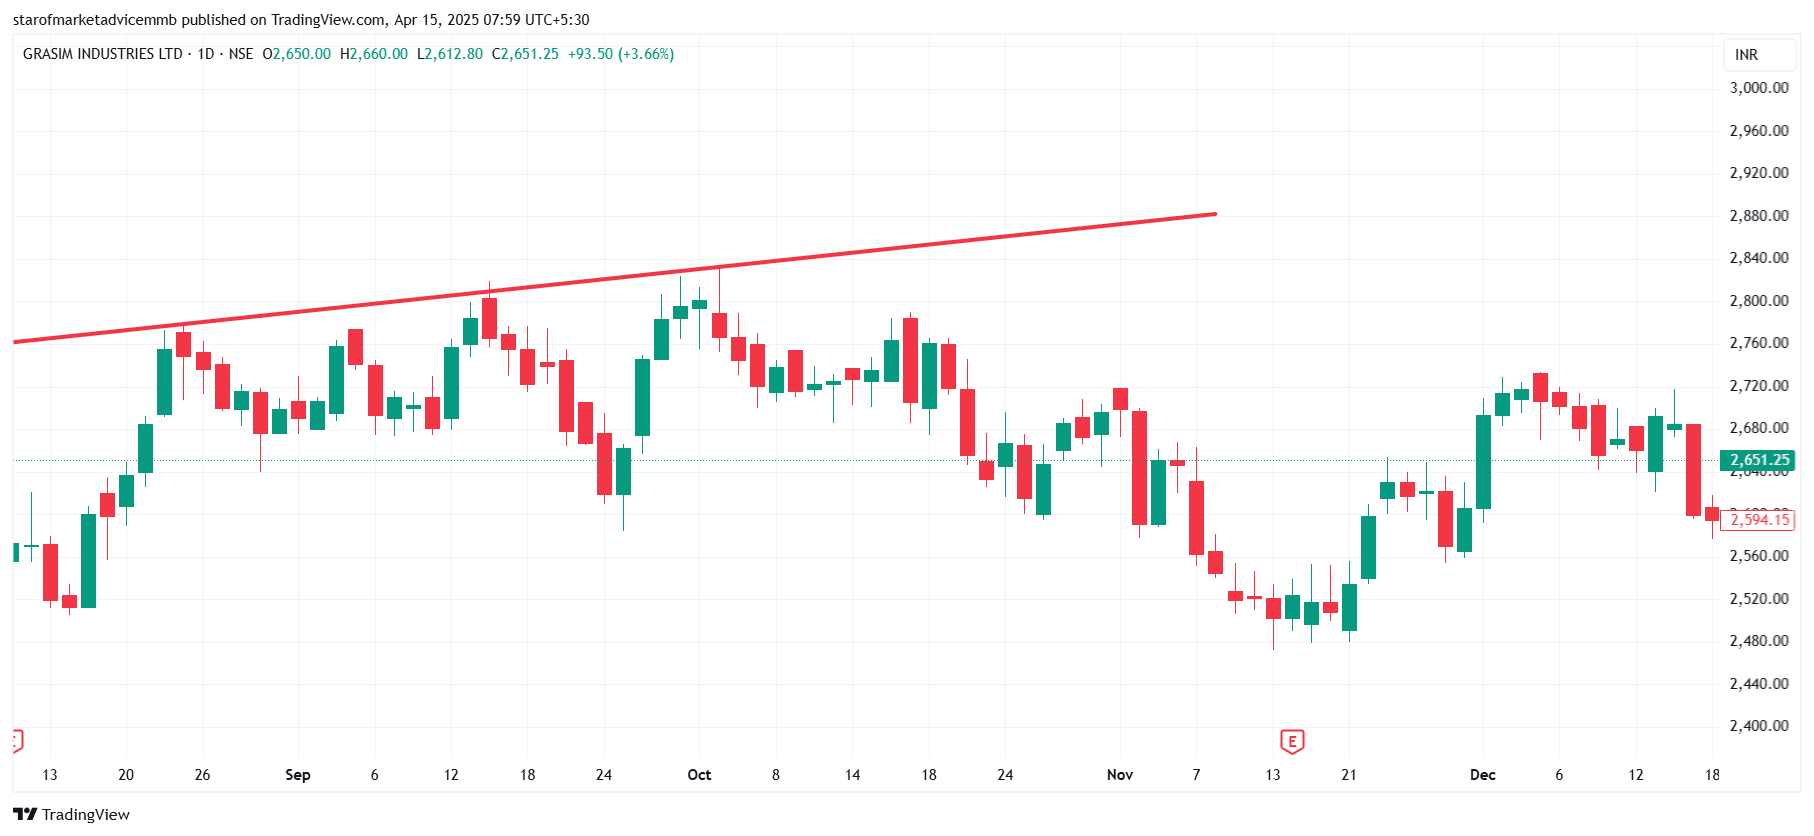
When a trendline acts as resistance, it’s like an invisible ceiling that the stock struggles to break through. Here's how it works:
📈 What is a Trendline Resistance?
It’s a descending line connecting lower highs during a downtrend.
The stock price approaches the line, gets rejected, and turns back down.
It shows sellers are stepping in at that level consistently.
🔍 What to Look for on the Chart:
✅ Multiple touches on the trendline — at least 2-3 points for confirmation
✅ Bearish reversal candles near the trendline (e.g., shooting star, bearish engulfing)
✅ Resistance may align with:
Previous swing highs
Fibonacci levels
Moving averages (like 50 or 200 EMA)